Data Analyst Tutorial – Learn Google BigQuery

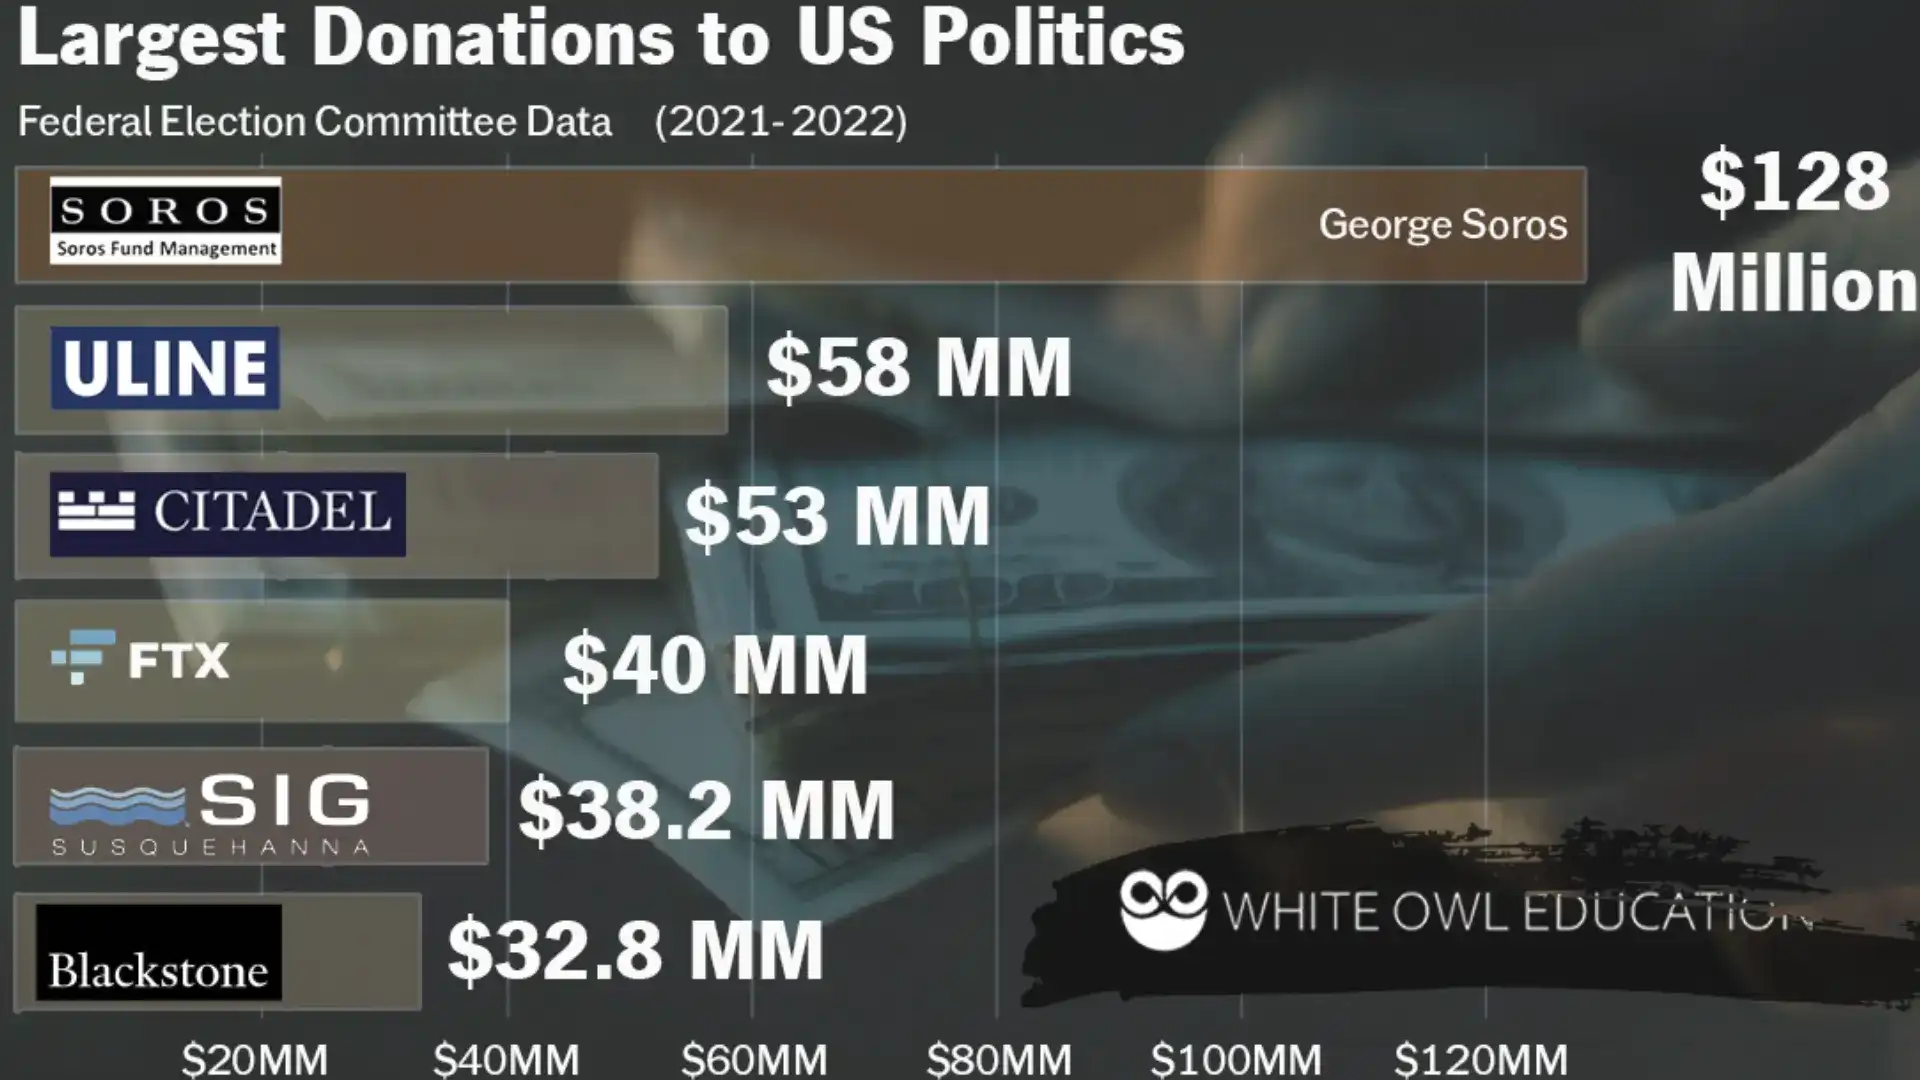
These are the top contributions by individuals in the 2022 mid-term elections. By the end of this blog, you will understand how you can use BigQuery to determine these numbers for yourself.
Increase your chances of getting a data analyst job by learning Google BigQuery!
LEARN HOW TO ANALYZE LARGE AMOUNTS OF DATA
Data analysts are required to look at large files to come up with some basic, business insights. In this tutorial, we're going to go end-to-end from identifying relevant data to producing a chart on a large amount of data. Knowing this skill is essential to get a job as a data analyst. By the end of this tutorial, you will know how to:
- Handle large data files and get quick insights using a powerful tool on Google Cloud (BigQuery)
- Put together BigQuery SQL statements to retrieve relevant data
- How to interpret 2022 Mid-term election donation data the same way journalists do it.
BEFORE YOU BEGIN
I want you to succeed in getting the skills you need to get a data analyst position. To really understand BigQuery and this blog, you need to have the following:
- You have access to Google cloud, Google Drive, and Google Colab.
- You Have set up Google Cloud storage.
- You have a project set up in Google Cloud.
- You have enabled billing for Google Cloud storage.
- You have a basic understanding of SQL and databases.
- Check out this blog I put together if you are looking for resources to start learning SQL.
If none of the above sounds familiar, do some Googling. The article will be here for you when you get back.
Google Cloud isn't free. You want to make sure that you delete data and release any resources that you used after you get done with this exercise.
Also, if you are reading this on mobile, make life easy for yourself, and turn your phone so it is horizontal for best viewing.
CASE STUDY:
2022 ELECTION DONATIONS
To understand the basics of Google Cloud and BigQuery, we are going to do a data analysis exercise. In the end, we will produce a bar chart which shows the contributions by some of the largest donors during the recent election.
First, we need a little bit of context about the data that we're going to explore. When people give money to politicians in the United States, the contributions are included in the data collected by the Federal Election Commission (the FEC). The FEC collects data on contributions by political committees as well as from individuals.


https://www.fec.gov/data/browse-data/?tab=bulk-data contains data
in different formats on election contributions.
We are going to look at a file from the Federal Election Commission in order to understand what particular individuals contributed. We'll get a bit more into file in just a second, but the key thing to note here is that the file (the CSV from “Contributions by Individuals, 2021-2022” is going to be about 8 GB in size, and we will need have a place where we can eventually put this processed file. Said differently, we are going to store this file within a bucket in Google Cloud Storage.
CREATE A BUCKET
TO STORE FEC DATA
The “contributions by individuals” file is fairly large. Because of this, we can’t upload this through the Google web interface that is associated with Big Query. Instead, we're going need to create a bucket within cloud storage.
I'm assuming that you've already got access to Google Cloud, and that you already have authorization from your organization to be able to store files and create buckets within Cloud Storage. If you have all of that, go to console.cloud.google.com/storage. Here, we're going to click on the button CREATE to add a new bucket.

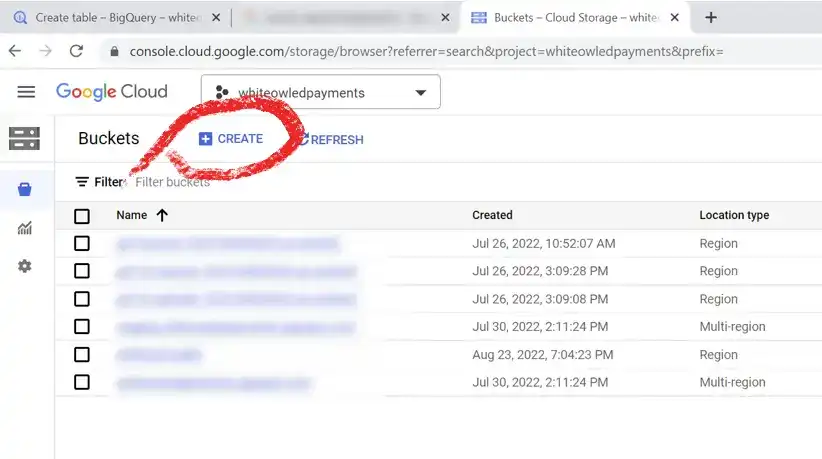
You can select CREATE to make a new bucket with the Cloud Storage web console.
NAME YOUR BUCKET
AND ASSIGN A REGION
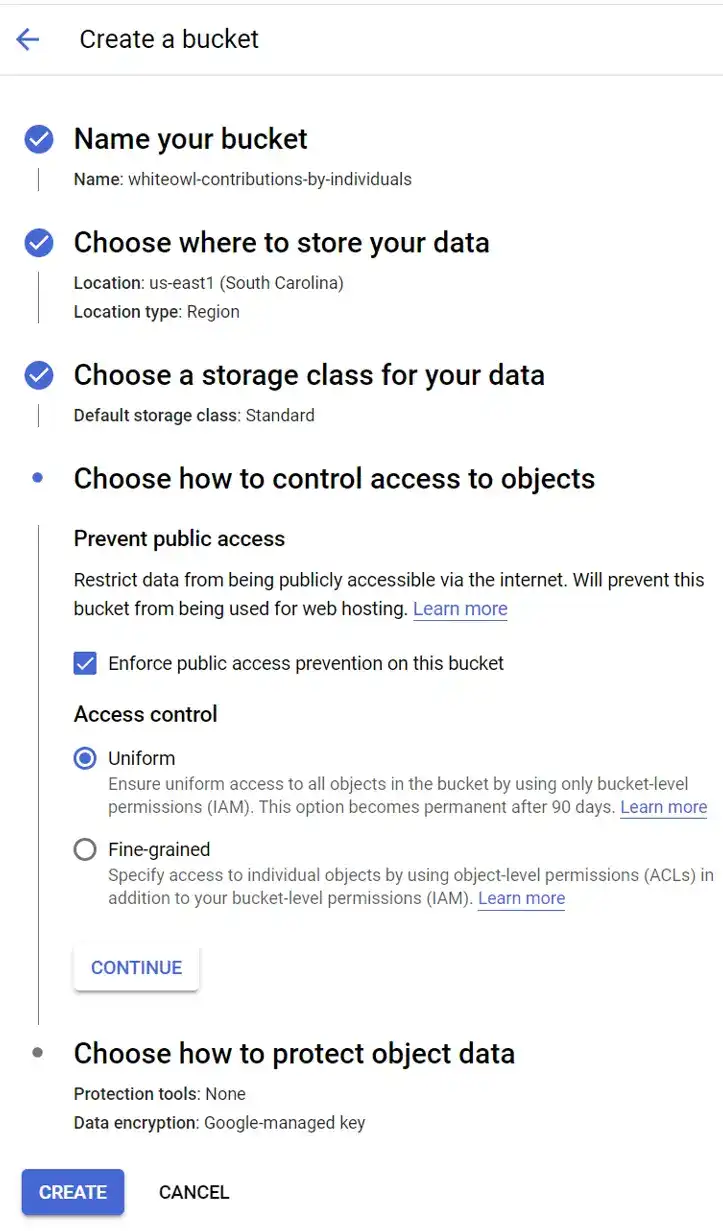
Give your storage bucket a unique name. In my case, I'm going to call the bucket whiteowl-contributions-by-individuals, but you need to pick something different. Buckets are hosted in one or more particular locations. Because I'm going to use this data for short amount of time, I'm just going to assign this to only one region (us-east1).
CHOOSE STORAGE CLASS

When you click on CREATE in Cloud Storage, you are going to see a lot of options for configuration.
Google Cloud will also ask for the storage class for this data. To address this, you need to think about the use of this data. Is this data that you're going to only access infrequently? Is this data something that you are only going to access once a month? For this case, I'm going to use the default which is Standard storage class, and this is the best option since this is a short-term analysis and Standard is used for short term storage and frequently accessed data.
ADDITIONAL BUCKET
CONFIGURATION NOTES
Here are a couple of additional notes that you should keep in mind as you are setting up the Google Cloud Storage bucket.
- This is data that we are just using for a quick analysis. It is data that I am not going to use for any commercial purpose. Because of this, I am going to enforce public access prevention on this bucket.
- I am going to use only bucket level permissions because I don't need different types of access for the files in this bucket.
- You should delete all the data from Google Storage when you are done. Don’t be concerned if the file accidentally gets deleted (because you can always regenerate it). Because of this I'm not going enable any additional protection tools.
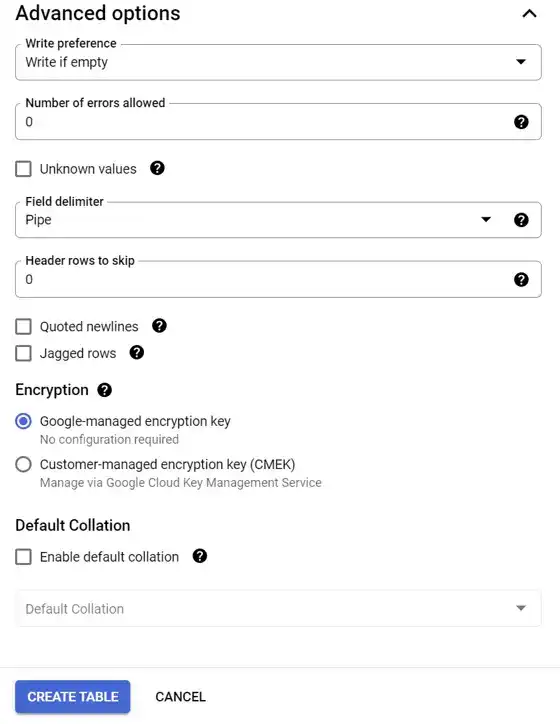
At the end of all of these steps, click CREATE to make your bucket.

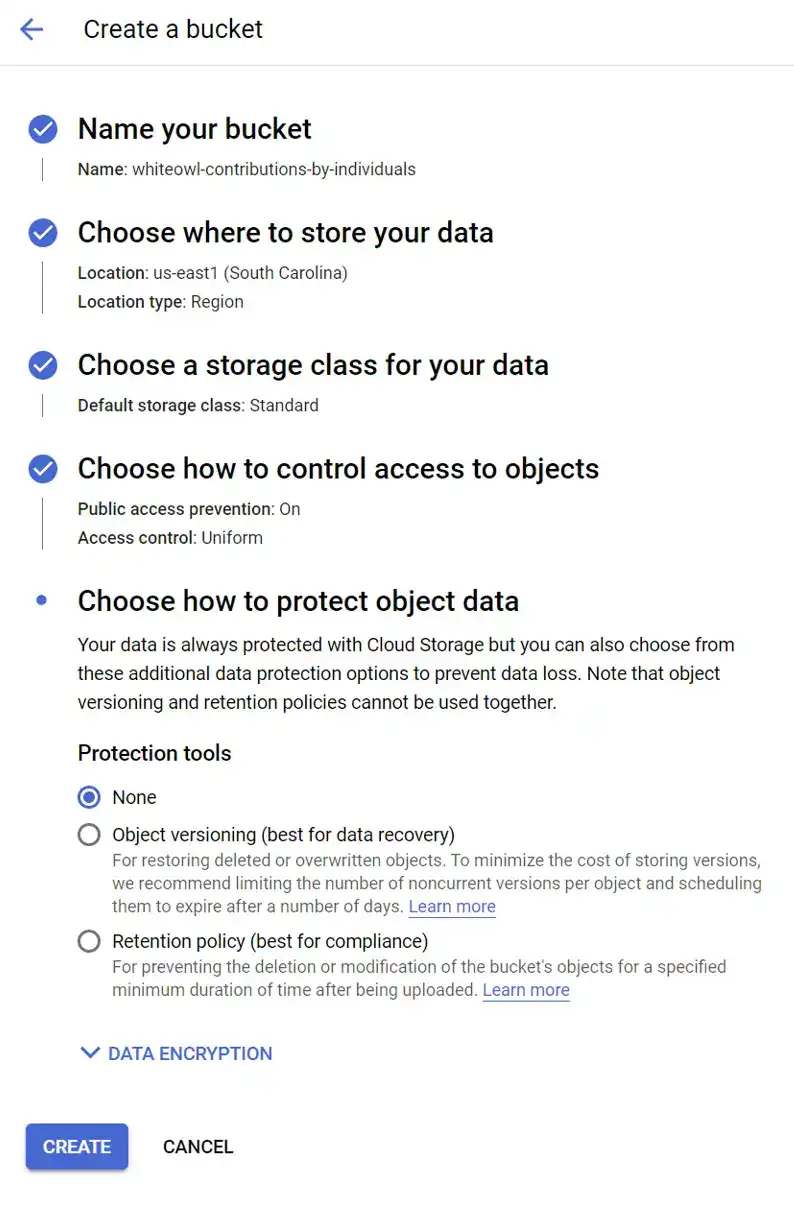
The final configuration for your Cloud Storage bucket.
Use Google Colab
to Accelerate Uploads of Data
I live in a part of Texas where upload speeds are about 10 Megs a second. I would imagine that there are parts of the world where upload speeds are even slower than that. This means it's going to take forever if you try to download data directly from then FEC and then upload that same file into Google cloud storage.
To solve this, we are going to use Google Colab. Google Colab allows you to write programs and to execute it directly from the web. Very convenient. In Colab, we are going to write a script that is going to pull from the FCC website directly into cloud storage without my slow Internet connection getting in the way. The details are in this Colab file.
Go ahead and take a look at this Google Colab, run the commands in this Colab, and come back here when you're done.
Create a dataset and table in BigQuery
One way to organize data is to put it into a database. It's just a storage of data. That is easily accessible. Databases pretty much run the world, everything from your credit score to. Tax information ends up getting stored in a database. For our analysis, we're going to simulate a database by creating a grouping of data. We are going to create a table within BigQuery.
Create a dataset by clicking on the three vertical buttons in the top level.
It's helpful first of all to have a best practice of organizing your tables together. We're going to do this through something that BigQuery calls a dataset. So we're going to go to the top level of the big query explorer, click on the three vertical dots, and create our dataset.

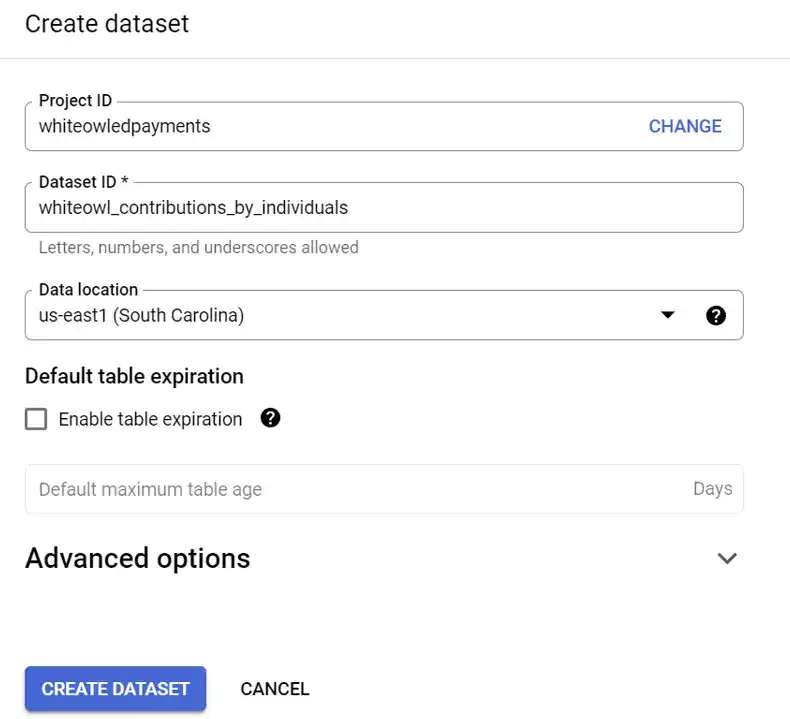
Create a dataset by giving it a unique ID.
Lets call our dataset whiteowl_contributions_by_individuals. We're going to assign it the data location (a region). For me, I am going to associate this dataset with us-east1.

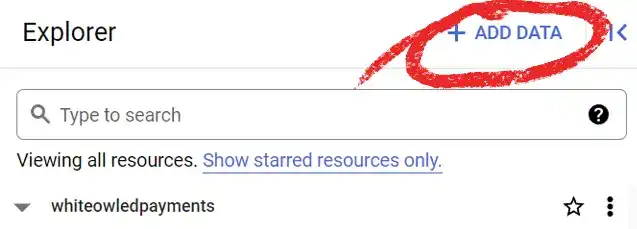
Click Add Data to start the process of creating a new table.
We are going to follow the procedure that is outlined in Google Cloud documentation to create our table. We begin by going to the BigQuery console (https://console.cloud.google.com/bigquery) and clicking on ADD DATA.

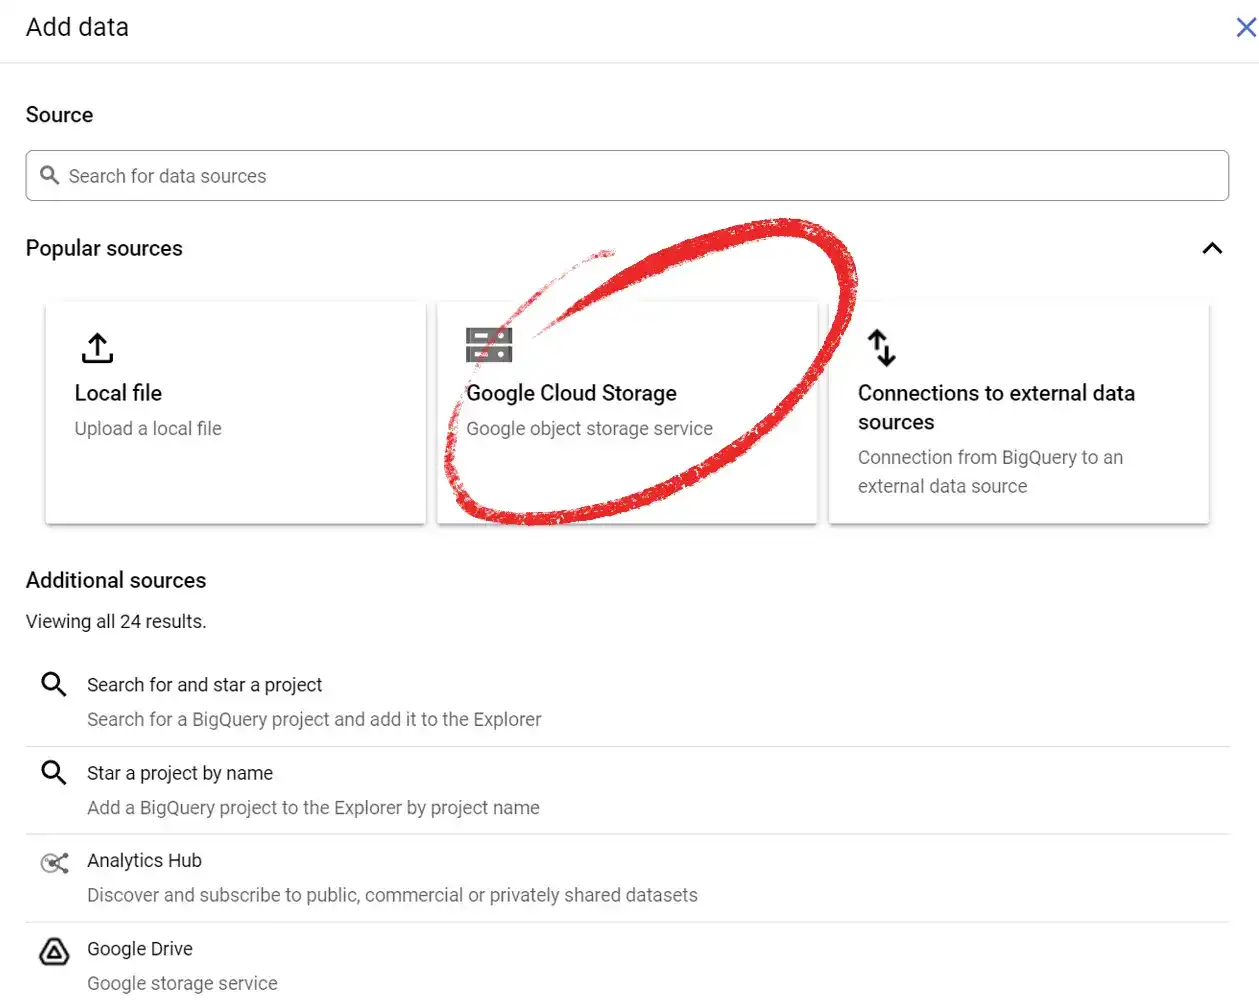
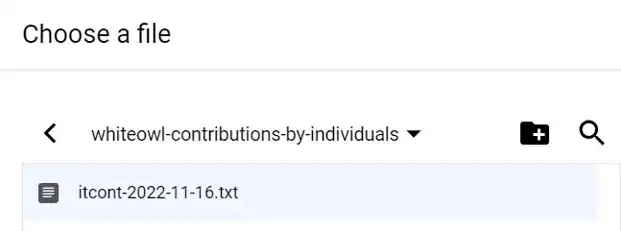
Identify where your data is located on Cloud Storage.
After clicking ADD DATA, you need to select Google Cloud Storage as the source. After you do that, select the bucket where you uploaded the data, select the data file that you uploaded with Google Colab, and click SELECT.

After selecting that, we're going to use a CSV format.
We are going to use the dataset that we just created ( whiteowl_contribution_by_individual_dataset), and lets call the table inside this dataset “contributions.”

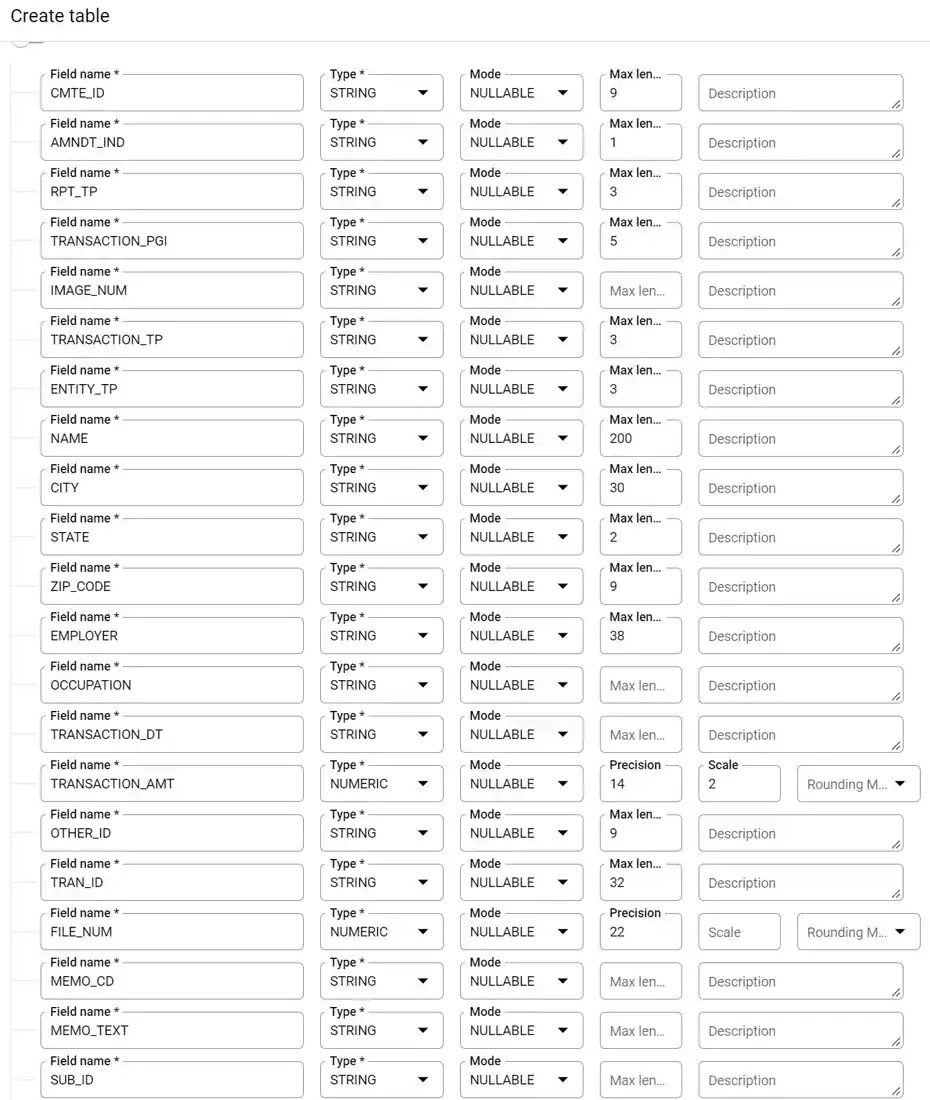
You want your table to have the same schema as what is seen in this picture.

The FEC file has fields separated by pipes. Make sure the pipe option is selected.
As seen in the picture above, go ahead and manually put in the schema fields by clicking on “ADD FIELD.” Schema fields is really a fancy name means “How the data is structured?” in the pipe separated file that you downloaded from the Federal Election Commission. Be careful here. Make sure that the spelling for each field precisely[1] matches what you see in the picture. For additional details on the schema for this file, take a look at the FEC site.
PRO TIP:
As you add fields manually, you can use tab to cycle between field, type, mode, max length, and description. If you hit Tab again, “Add field” is selected, and when add field is selected, hitting ENTER will create another field for you.

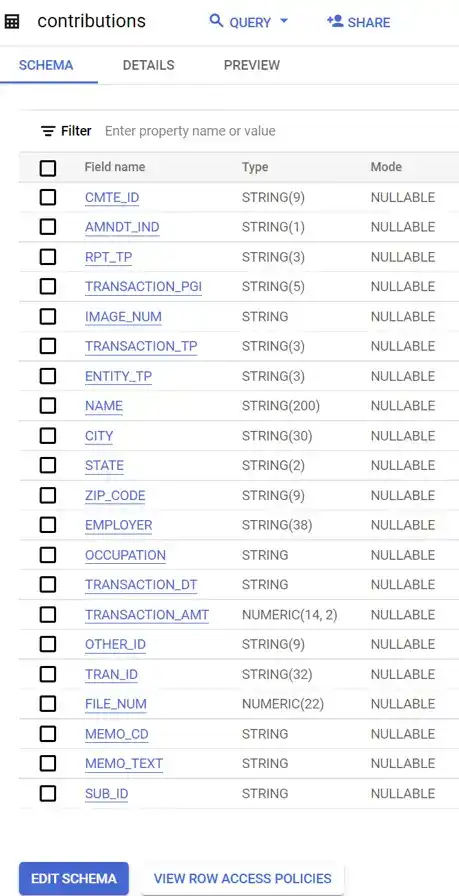
This is a display of the schema once it is entered.
Create a table for the Transaction Code Classifications
To complete this exercise, not only are we going to need the contributions from individuals. But we will need to know if those contributions were to a political action committee or if they were to a candidate, or if they were a refund, or if they were some other transaction type. All of this information was captured as part of the collab notebook that we mentioned above And that by this point should be in Google Cloud Storage.
To use this data, we're going to repeat the same process that we just went through in terms of creating a table and we're going to do that for this transactions-classes.txt file. We are going to add data. We're going to select Google Cloud storage. We're will select transactions-classes.txt from Google Cloud and when we do that we should see something similar to the following:

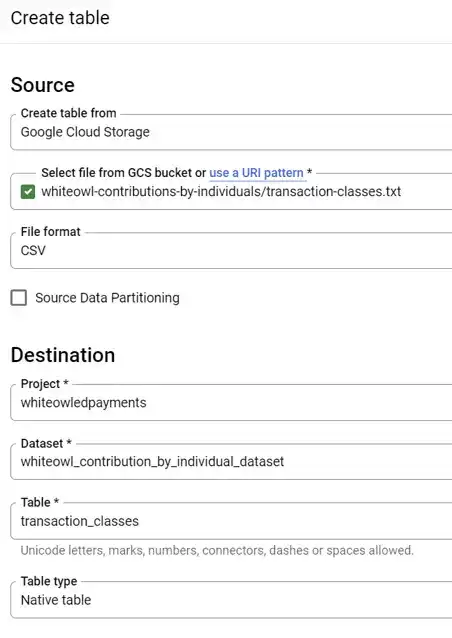

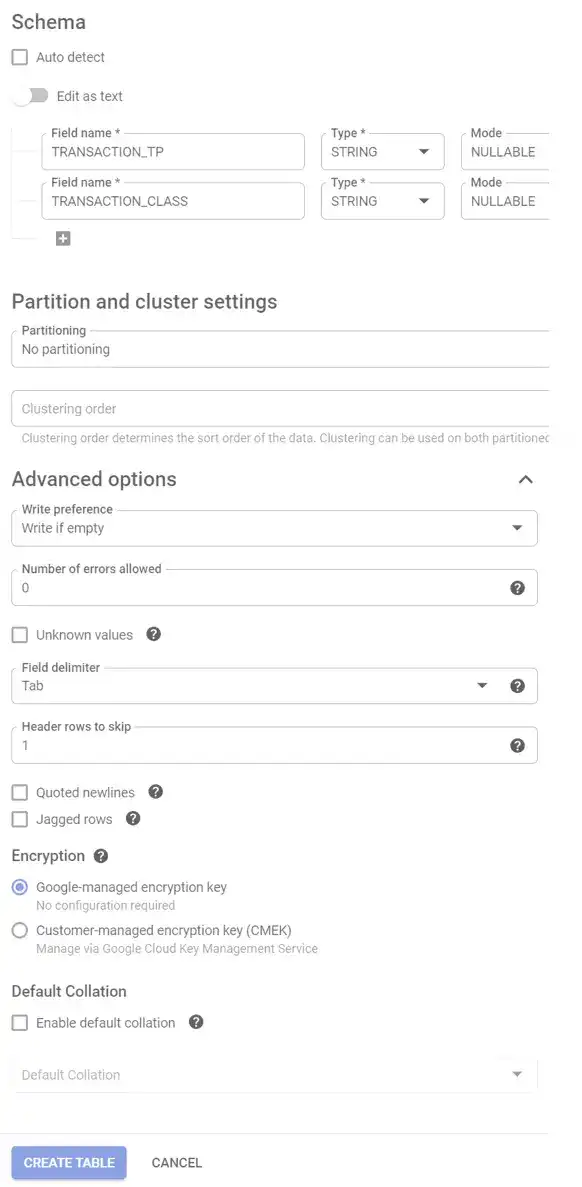
For the transaction classes file, be sure to select TAB as the delimiter.
EXPLORE THE DATA
Lets do a sanity check now on the data to make sure that it is at least somewhat in alignment with what we see in the general press. Put the following in for your query:
SELECT COUNT(*) AS count_x
FROM `whiteowledpayments.whiteowl_contributions_by_individuals.contributions`

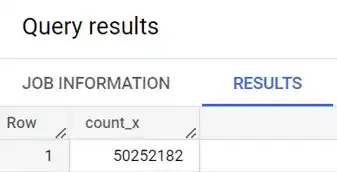
This query shows ~50M rows in the table.
In this query, we are using the COUNT function to determine that there are 50 million rows in the table.
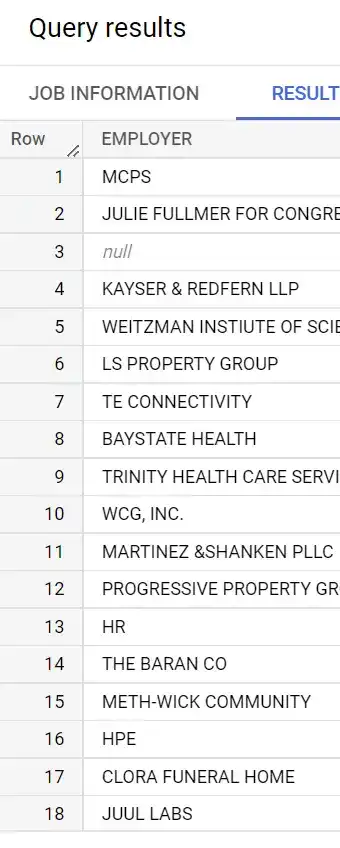
Now, lets look at employer in this table. Copy and paste the following query, and then click RUN.
SELECT EMPLOYER
FROM `whiteowledpayments.whiteowl_contributions_by_individuals.contributions`
LIMIT 100;

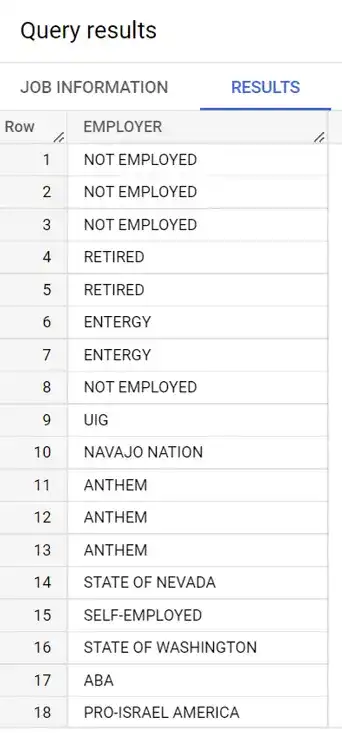
Ok, things are looking good so far. What does it look like if we pick out distinct employers?
SELECT DISTINCT(EMPLOYER)
FROM `whiteowledpayments.whiteowl_contributions_by_individuals.contributions`
LIMIT 100;

Now, lets push forward and start to look at transaction amounts. In BigQuery, give the following query a try:
SELECT EMPLOYER, SUM(TRANSACTION_AMT) as TOTAL_CONTRIBUTION
FROM `whiteowledpayments.whiteowl_contributions_by_individuals.contributions`
GROUP BY EMPLOYER
ORDER BY TOTAL_CONTRIBUTION DESC

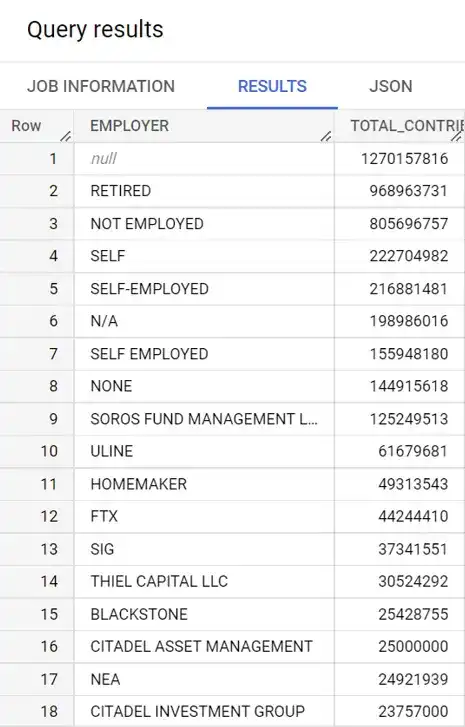
It seems like there are a lot of contributions from individuals where the employer is not listed. Let's do another query where we look at the individual name instead.
SELECT NAME, ENTITY_TP, EMPLOYER, OCCUPATION
FROM `whiteowledpayments.whiteowl_contributions_by_individuals.contributions`
WHERE EMPLOYER IS NULL
ORDER BY TRANSACTION_AMT DESC
LIMIT 100

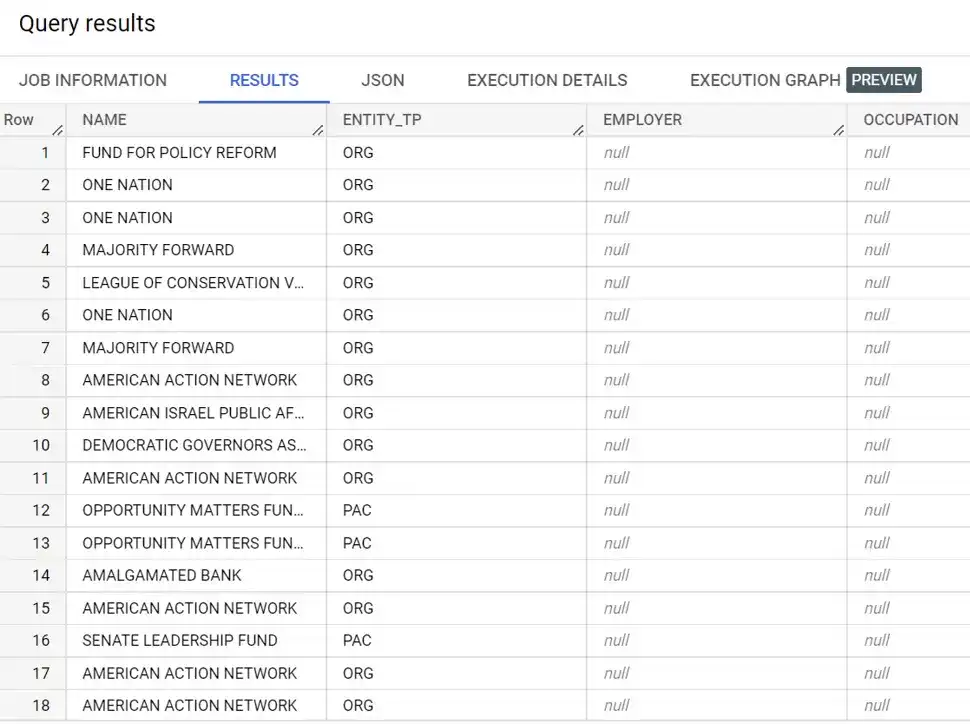
Using BigQuery SQL, we see the contribution by individuals file includes information about organizations.
This is progress. Even though the dataset was labeled “Contributions by individuals”, we definitely see the data includes information for organizations as well. As we see below, this table contains information about individual donations (IND), Political Action Committees (PAC), Organizations (ORG), and other information.
SELECT DISTINCT(ENTITY_TP)
FROM `whiteowledpayments.whiteowl_contribution_by_individual_dataset.contributions`
LIMIT 100
Given that the data includes donations for multiple types of entities, it seems like we might make more progress towards insights if we focus only on individuals for right now.
Make sure analysis is consistent with reality
PRO TIP:
Your work is only as good as your data. You want to make sure that you have a clean data set before gathering insights.
One way to be able to create a clean data set is to look at the data through the lens of what is consistent with reality. If other journalists have reported election donations by a particular individual, then one anchor into that reality would be to look at a famous individual and see how the numbers match up. In the news leading up to the election, there was a lot of mention of George Soros contributing to politicians. Let's go ahead, and use that name to see if what's reported in the media is consistent with the data.
SELECT ENTITY_TP, RPT_TP, NAME, EMPLOYER, TRANSACTION_TP, TRANSACTION_AMT
FROM `whiteowledpayments.whiteowl_contributions_by_individuals.contributions`
WHERE ENTITY_TP = "IND" AND NAME = "SOROS, GEORGE"
ORDER BY TRANSACTION_AMT DESC

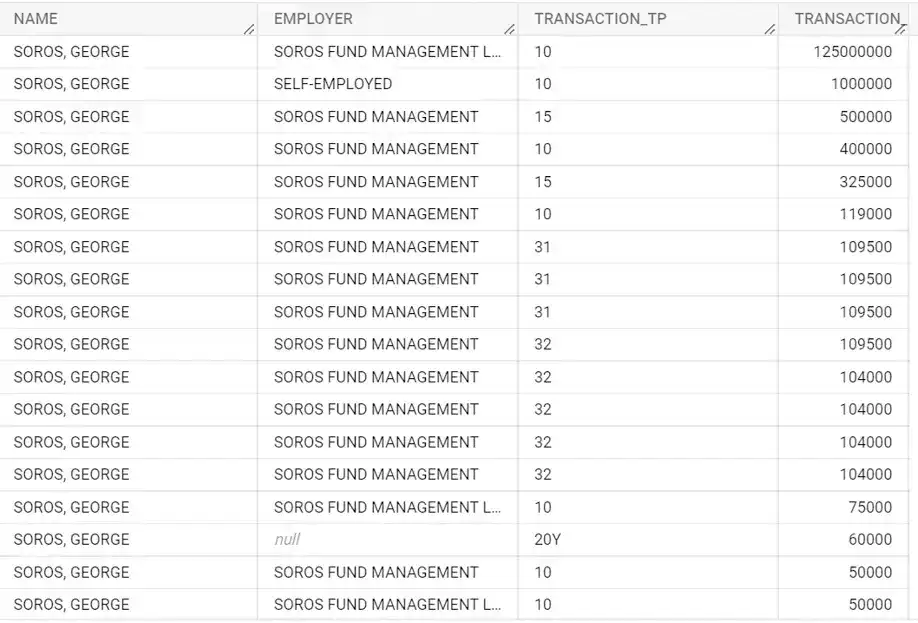
Contributions are consistent with what is reported in the news.
When we run this query, we see information that aligns up with reality. The top line that is returned from this query shows a donation of $125 million from George Soros, and this is consistent with what we see in the news.
Combine Tables Together
At this point, we have one table which contains contributions from individuals. We also have another table which can categorize the types of classifications. To get a list of top donors, it makes sense to combine these two tables together so that we can look at the contributions for an individual less any refunds that that individual got back.
create or replace table `whiteowledpayments.whiteowl_contributions_by_individuals.contributions_transactclass` as (
SELECT A.NAME as DONOR_NAME,
B.TRANSACTION_CLASS as TRANSACT_CLASS,
SUM(TRANSACTION_AMT) as TOTAL_AMT,
FROM `whiteowledpayments.whiteowl_contributions_by_individuals.contributions` AS A
LEFT OUTER JOIN `whiteowledpayments.whiteowl_contributions_by_individuals.transaction_classes` AS B
ON A.TRANSACTION_TP = B.TRANSACTION_TP
GROUP BY DONOR_NAME,TRANSACT_CLASS
)
Once we have that table created, it's now time to get our insights.
Obtain Insights
To get a top list of donors from our tables, we need to construct a query with the name, the amount that was contributed to the political action committee, the amount that was contributed to the candidate, and any amount that was refunded. All these classifications are available with transaction classes mapping that we constructed Google Colab, and that we ingested as a separate table.
SELECT PAC.DONOR_NAME, PAC.TOTAL_AMT as PAC_AMT,
CAN.TOTAL_AMT AS CAN_AMT, RFND.TOTAL_AMT as REFUND_AMT
FROM
(
SELECT DONOR_NAME, TOTAL_AMT
FROM `whiteowledpayments.whiteowl_contributions_by_individuals.contributions_transactclass`
WHERE TRANSACT_CLASS = "PAC") as PAC
LEFT OUTER JOIN
(
SELECT DONOR_NAME, TOTAL_AMT
FROM `whiteowledpayments.whiteowl_contributions_by_individuals.contributions_transactclass`
WHERE TRANSACT_CLASS = "CAN") as CAN
ON PAC.DONOR_NAME = CAN.DONOR_NAME
LEFT OUTER JOIN
(
SELECT DONOR_NAME, TOTAL_AMT
FROM `whiteowledpayments.whiteowl_contributions_by_individuals.contributions_transactclass`
WHERE TRANSACT_CLASS = "REFUND") as RFND
ON PAC.DONOR_NAME = RFND.DONOR_NAME
ORDER BY PAC_AMT DESC
LIMIT 1000
This query is presented above is a little complicated, but let’s break it down. We are going to do 3 selections of data and then bundle them together. We're going to have one mini query that pulls donor name, and total amount for political action committee donations. In the query, I call this subquery PAC.
I create similar query to get name and donations for the candidate by pulling all rows where the TRANSACT_CLASS = “CAN.”
Then, I get a list of all donor names and the corresponding refund line items. I call this subquery RFND.
At each step along the way, we're going to take a table, and match it against a second table without deleting any of the rows of the original table. In SQL this is referred to as a left outer join .

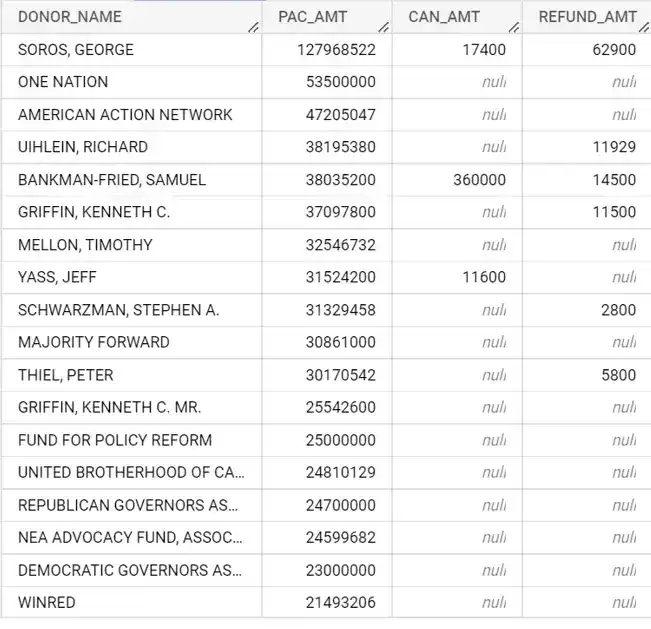
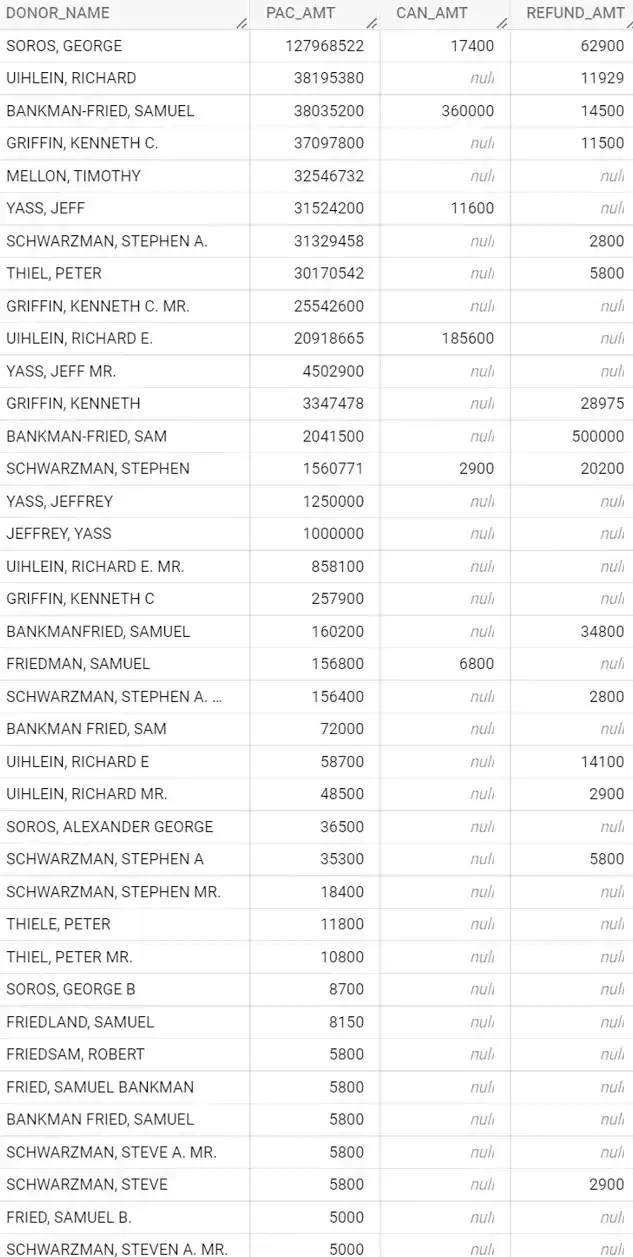
Top donors in the 2022 mid-term election included Soros, Uihlein, SBF, Griffin, Mellon, Yass, Schwarzman, and Thiel.
When we examine the results, we'll see that George Soros contributed close to 128 million to political action committees, and that it contributed 17,000 directly to the candidates. We also see that Soros received lose to 63,000 in refunds. Intuitively, this makes sense. Individuals are allowed to contribute an unlimited amount of money to political action committees as long those committees do not coordinate with political candidates. We also know that the amount that an individual can directly contribute to candidates is capped.
When we look at the list of donors in the query results above, you can see that some of the top individual donors are George Soros, Richard Uihlein, Samuel Bankman-Fried, Kenneth Griffin, Timothy Mellon, Jeff Yass, Steven Schwarzman, and Peter Thiel.
Double Check Results
Once we have our final list of the donors that we're going to turn into a table. One last step that probably makes sense is just to double check to make sure that there aren't any donor names that are similar. That could throw off the numbers that we're going to report. The way that we can do this is by just doing a pattern match against the last names of these top individuals.
Said differently, we're going to do a regular expression within BigQuery to see if the Donor name contains any of the names of the large donors. We are going to do a REGEXP_CONTAINS to match against the last name and part of the first name of large donors to refine our results.
How do you use REGEXP_CONTAINS
in a where clause?
The final query looks like this:
SELECT PAC.DONOR_NAME,
PAC.TOTAL_AMT as PAC_AMT,
CAN.TOTAL_AMT AS CAN_AMT,
RFND.TOTAL_AMT as REFUND_AMT
FROM
(
SELECT DONOR_NAME, TOTAL_AMT
FROM `whiteowledpayments.whiteowl_contributions_by_individuals.contributions_transactclass`
WHERE TRANSACT_CLASS = "PAC") as PAC
LEFT OUTER JOIN
(
SELECT DONOR_NAME, TOTAL_AMT
FROM `whiteowledpayments.whiteowl_contributions_by_individuals.contributions_transactclass`
WHERE TRANSACT_CLASS = "CAN") as CAN
ON PAC.DONOR_NAME = CAN.DONOR_NAME
LEFT OUTER JOIN
(
SELECT DONOR_NAME, TOTAL_AMT
FROM `whiteowledpayments.whiteowl_contributions_by_individuals.contributions_transactclass`
WHERE TRANSACT_CLASS = "REFUND") as RFND
ON PAC.DONOR_NAME = RFND.DONOR_NAME
WHERE (
( REGEXP_CONTAINS(PAC.DONOR_NAME, r'SOROS')
	AND REGEXP_CONTAINS(PAC.DONOR_NAME, r'GEORGE') )
OR ( REGEXP_CONTAINS(PAC.DONOR_NAME, r'GRIFFIN')
	AND REGEXP_CONTAINS(PAC.DONOR_NAME, r'KEN') )
OR ( REGEXP_CONTAINS(PAC.DONOR_NAME, r'UIHLEIN')
	AND REGEXP_CONTAINS(PAC.DONOR_NAME, r'RICHARD') )
OR ( REGEXP_CONTAINS(PAC.DONOR_NAME, r'FRIED')
	AND REGEXP_CONTAINS(PAC.DONOR_NAME, r'SAM') )
OR ( REGEXP_CONTAINS(PAC.DONOR_NAME, r'MELLON')
	AND REGEXP_CONTAINS(PAC.DONOR_NAME, r'TIM') )
OR ( REGEXP_CONTAINS(PAC.DONOR_NAME, r'SCHWARZMAN')
	AND REGEXP_CONTAINS(PAC.DONOR_NAME, r'STE') )
OR ( REGEXP_CONTAINS(PAC.DONOR_NAME, r'THIEL')
	AND REGEXP_CONTAINS(PAC.DONOR_NAME, r'PE') )
OR ( REGEXP_CONTAINS(PAC.DONOR_NAME, r'YASS')
	AND REGEXP_CONTAINS(PAC.DONOR_NAME, r'JE') )
)
ORDER BY PAC_AMT DESC
LIMIT 1000

Contributions are consistent with what is reported in the news.
When we look at the list of donors in the query results above, you can see that some of the top individual donors are in approximate amounts as follows:
- George Soros (Soros Fund Management): $128 million
- Richard Uihlein (Uline): $58 million
- Ken Griffin (Citadel): $53 million
- Sam Bankman-Fried (formerly of FTX) $40 million
- Jeff Yass (SIG): $38.2 million
- Steven Schwarzman (Blackstone): $32.8 million
SUMMARY

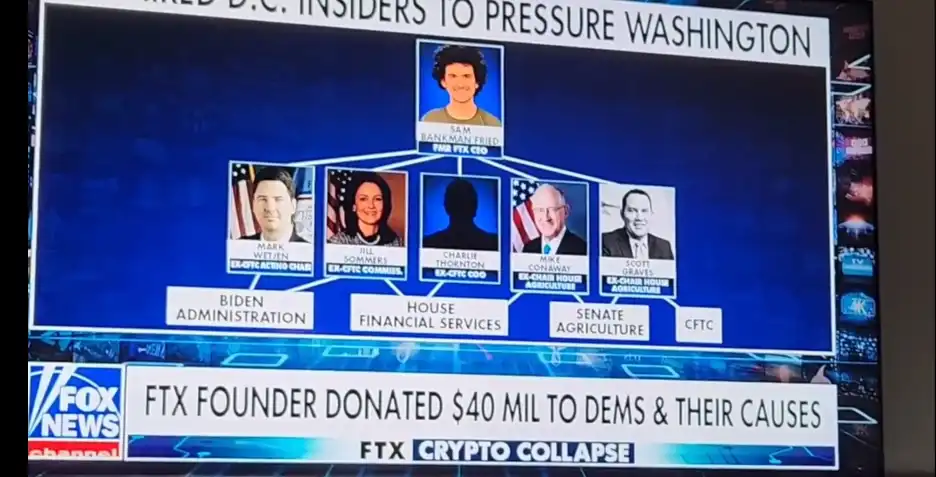
The $40m in our analysis matches up to what was recently seen on Fox News.
In this blog, you learned how to analyze 50 million rows of election contribution data. Using Google BigQuery. We started out by using Google Colab to send relevant files to Google Cloud Storage. We created tables in BigQuery based on the files. We did some basic data exploration, and we became familiar with the data by tying back our results to generally accepted knowledge (we made sure our analysis was consistent with reality). After we had a good sense of the data. We used regular expressions to identify the top individual donations in the 2022 midterm election.
Was this blog helpful?
White Owl Education does not exist without your support. If you learned something today, please support the site with a small donation.