Use Explainable AI to Prove Image Classification Works
Learn about heatmaps for image classification to pass the GCP Machine Learning Engineer exam!
If you are building some impressive AI that works with images, it is not enough for your model to perform well. Executives and managers who make decisions based off of your work want to know WHY your program performs well. This is so important that the Google Cloud Machine Learning Engineer certification even covers this as an exam topic.
In this blog, we are going to look at a sample exam question about an image classifier that detects pandas at a zoo to understand why Explainable AI is worth a closer look. Along the way, I will provide some takeaways as to how you can best prepare for the Google Cloud Machine Learning Engineer exam.
By the end of this blog you will know how to:
- Use integrated gradients (a possible topic on the certification exam ) to create heatmaps which are useful for understanding image classification models!
- Know the context for using (or avoiding) popular data science about popular data science techniques such as PCA, K-fold cross validation, and K-Means Clustering.
- Breakdown a Google Cloud Professional Machine Learning Engineer certification question into something that you can easily answer.
Sample Question
One of the sample questions for the Machine Learning Engineer certification is similar to the following:
You work for a zoo and have been asked to build a model to detect and classify pandas. You trained a machine learning model with high recall based on high resolution images taken from a security camera. You want management to gain trust in your model. Which technique should you use to understand the rationale of your classifier?
Understanding the Context
You have trained a model with high recall. The high recall of this model means that not many of the pandas at the zoo are going to be undetected.
If you look on Wikipedia, you will see that the formula for recall is:
This metric of model success looks at the number of pandas correctly identified (the true positives or ) as a percentage of all pandas at the zoo. As you see in the formula, all pandas consists of the correctly identified pandas as well as the animals are pandas but that are identified as something else (the “false negatives” or ).
Whenever you are looking at recall, you also need to consider precision (a measure of quality). The last thing you want is a model that captures all defects (high recall) but requires you to look at images for a majority of the animals (low precision).
TAKEAWAY
Part of this question is asking about model evaluation. The study guide for the exam refers to this as:
1.2 Definining ML Problems
- Outcome of model predictions
Similar concepts are discussed in the model evaluation portion of the Auto ML documentation .
Explainable AI can help to determine why a model is working correctly
If one part of the question is asking about model outcomes, another part is definitely asking about rationale or explainability. You could argue that seeing that word rationale means that whatever the answer is to this question needs to be something that explains your model well. Said differently - when you see the word rationale, the first thing that you should be thinking about is a list of Google products that explain AI well.
Integrated Gradients
Understanding the pixels that influence the classification decision is critical to provide a rationale.
Option B is the correct answer!
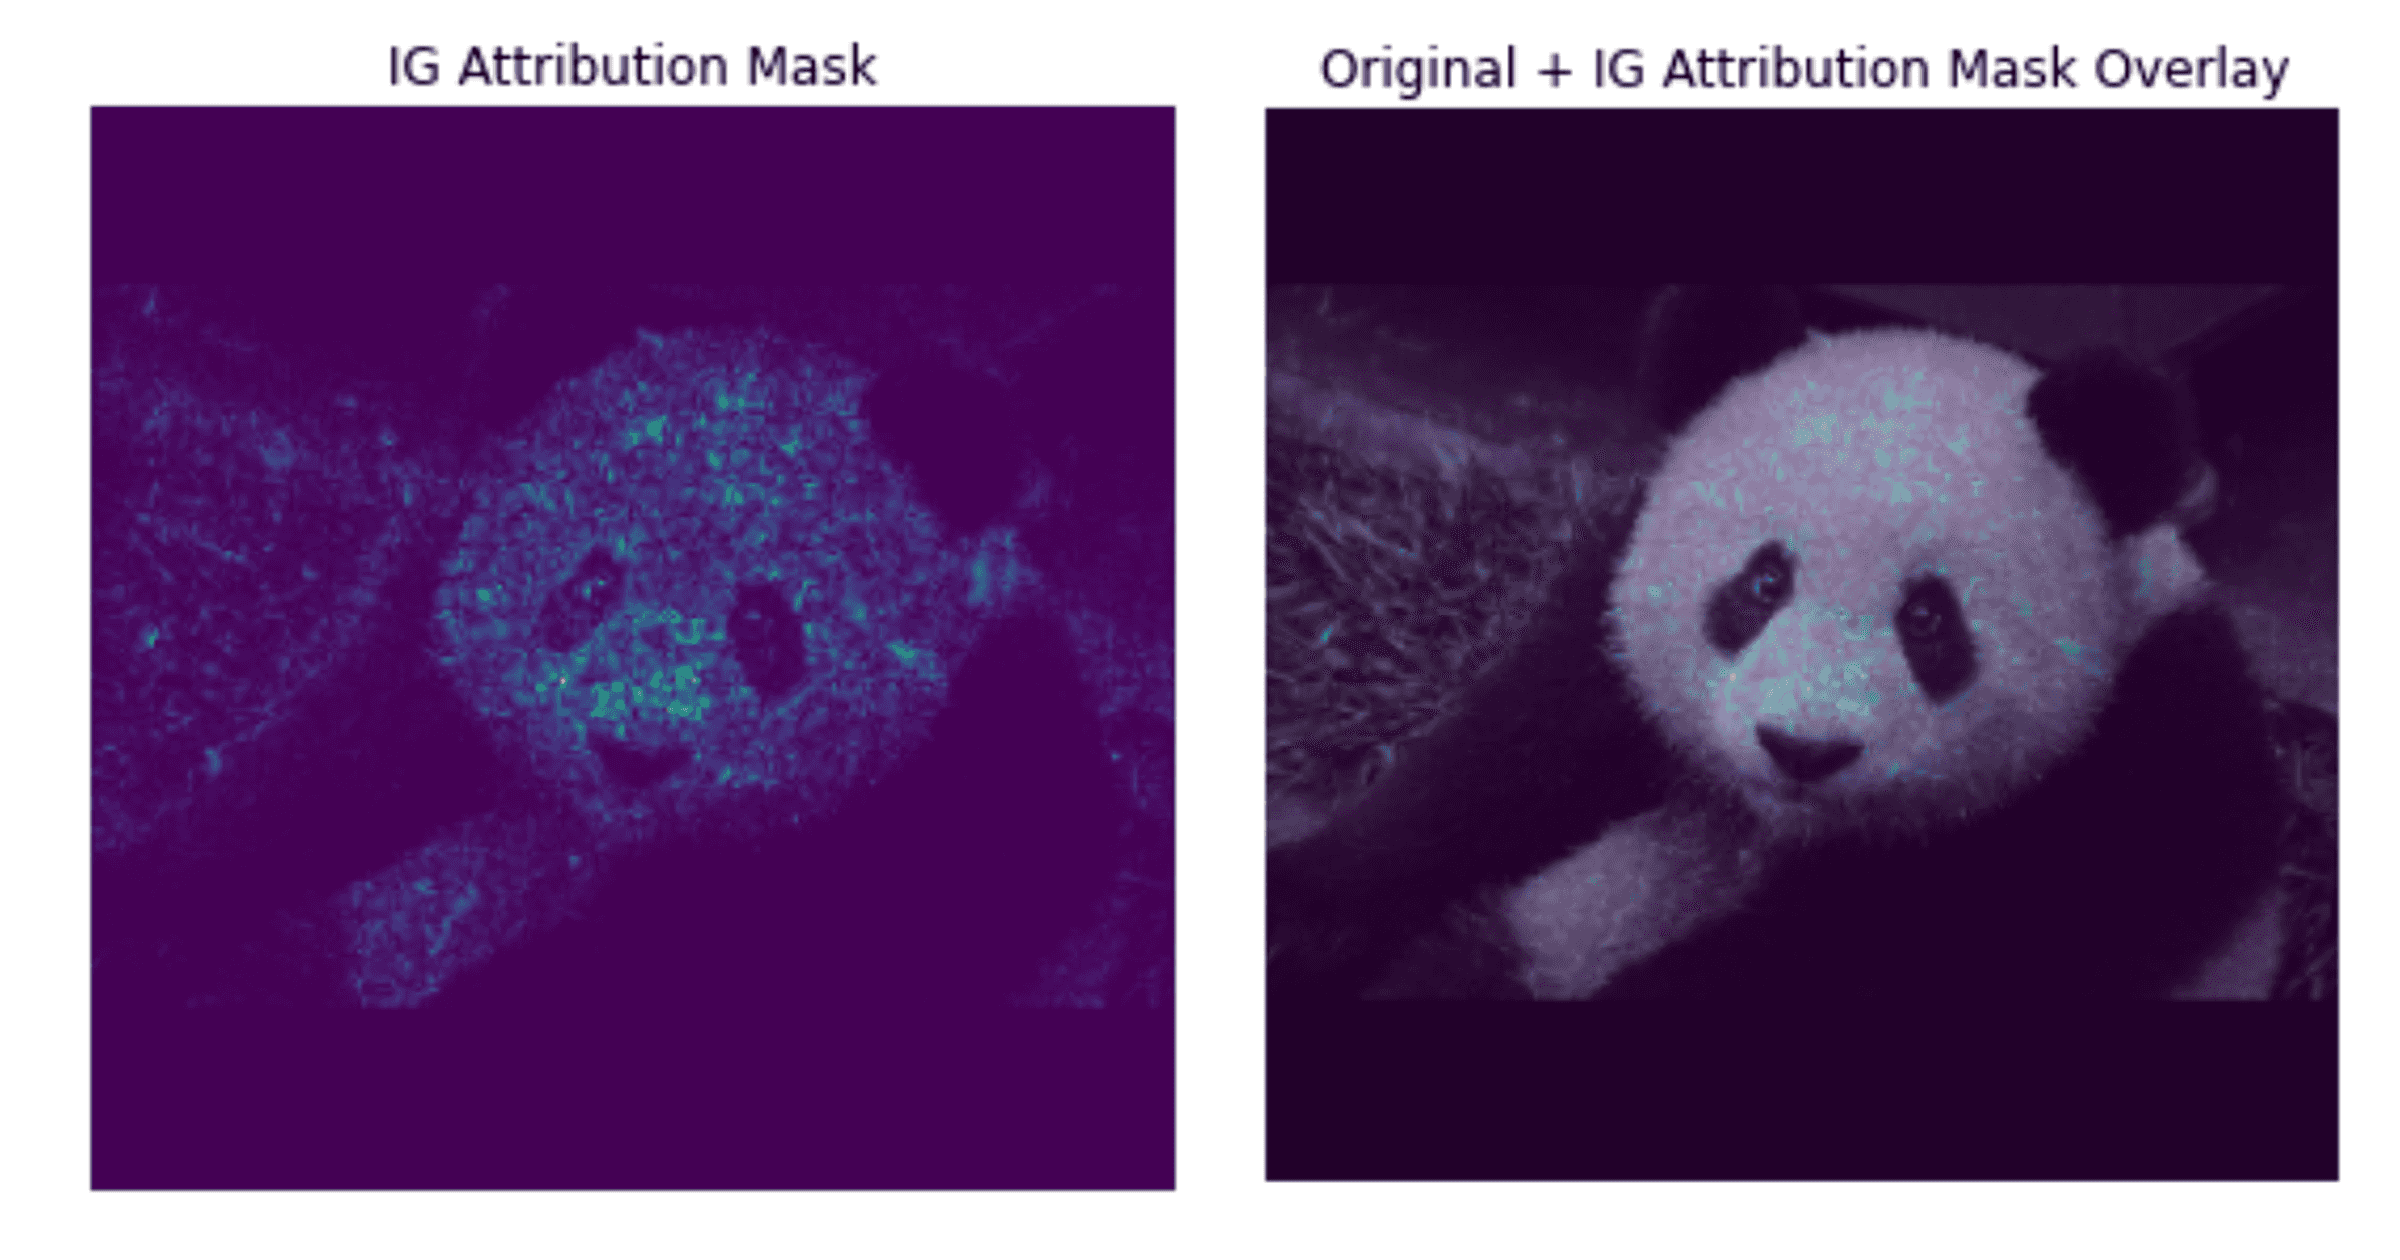
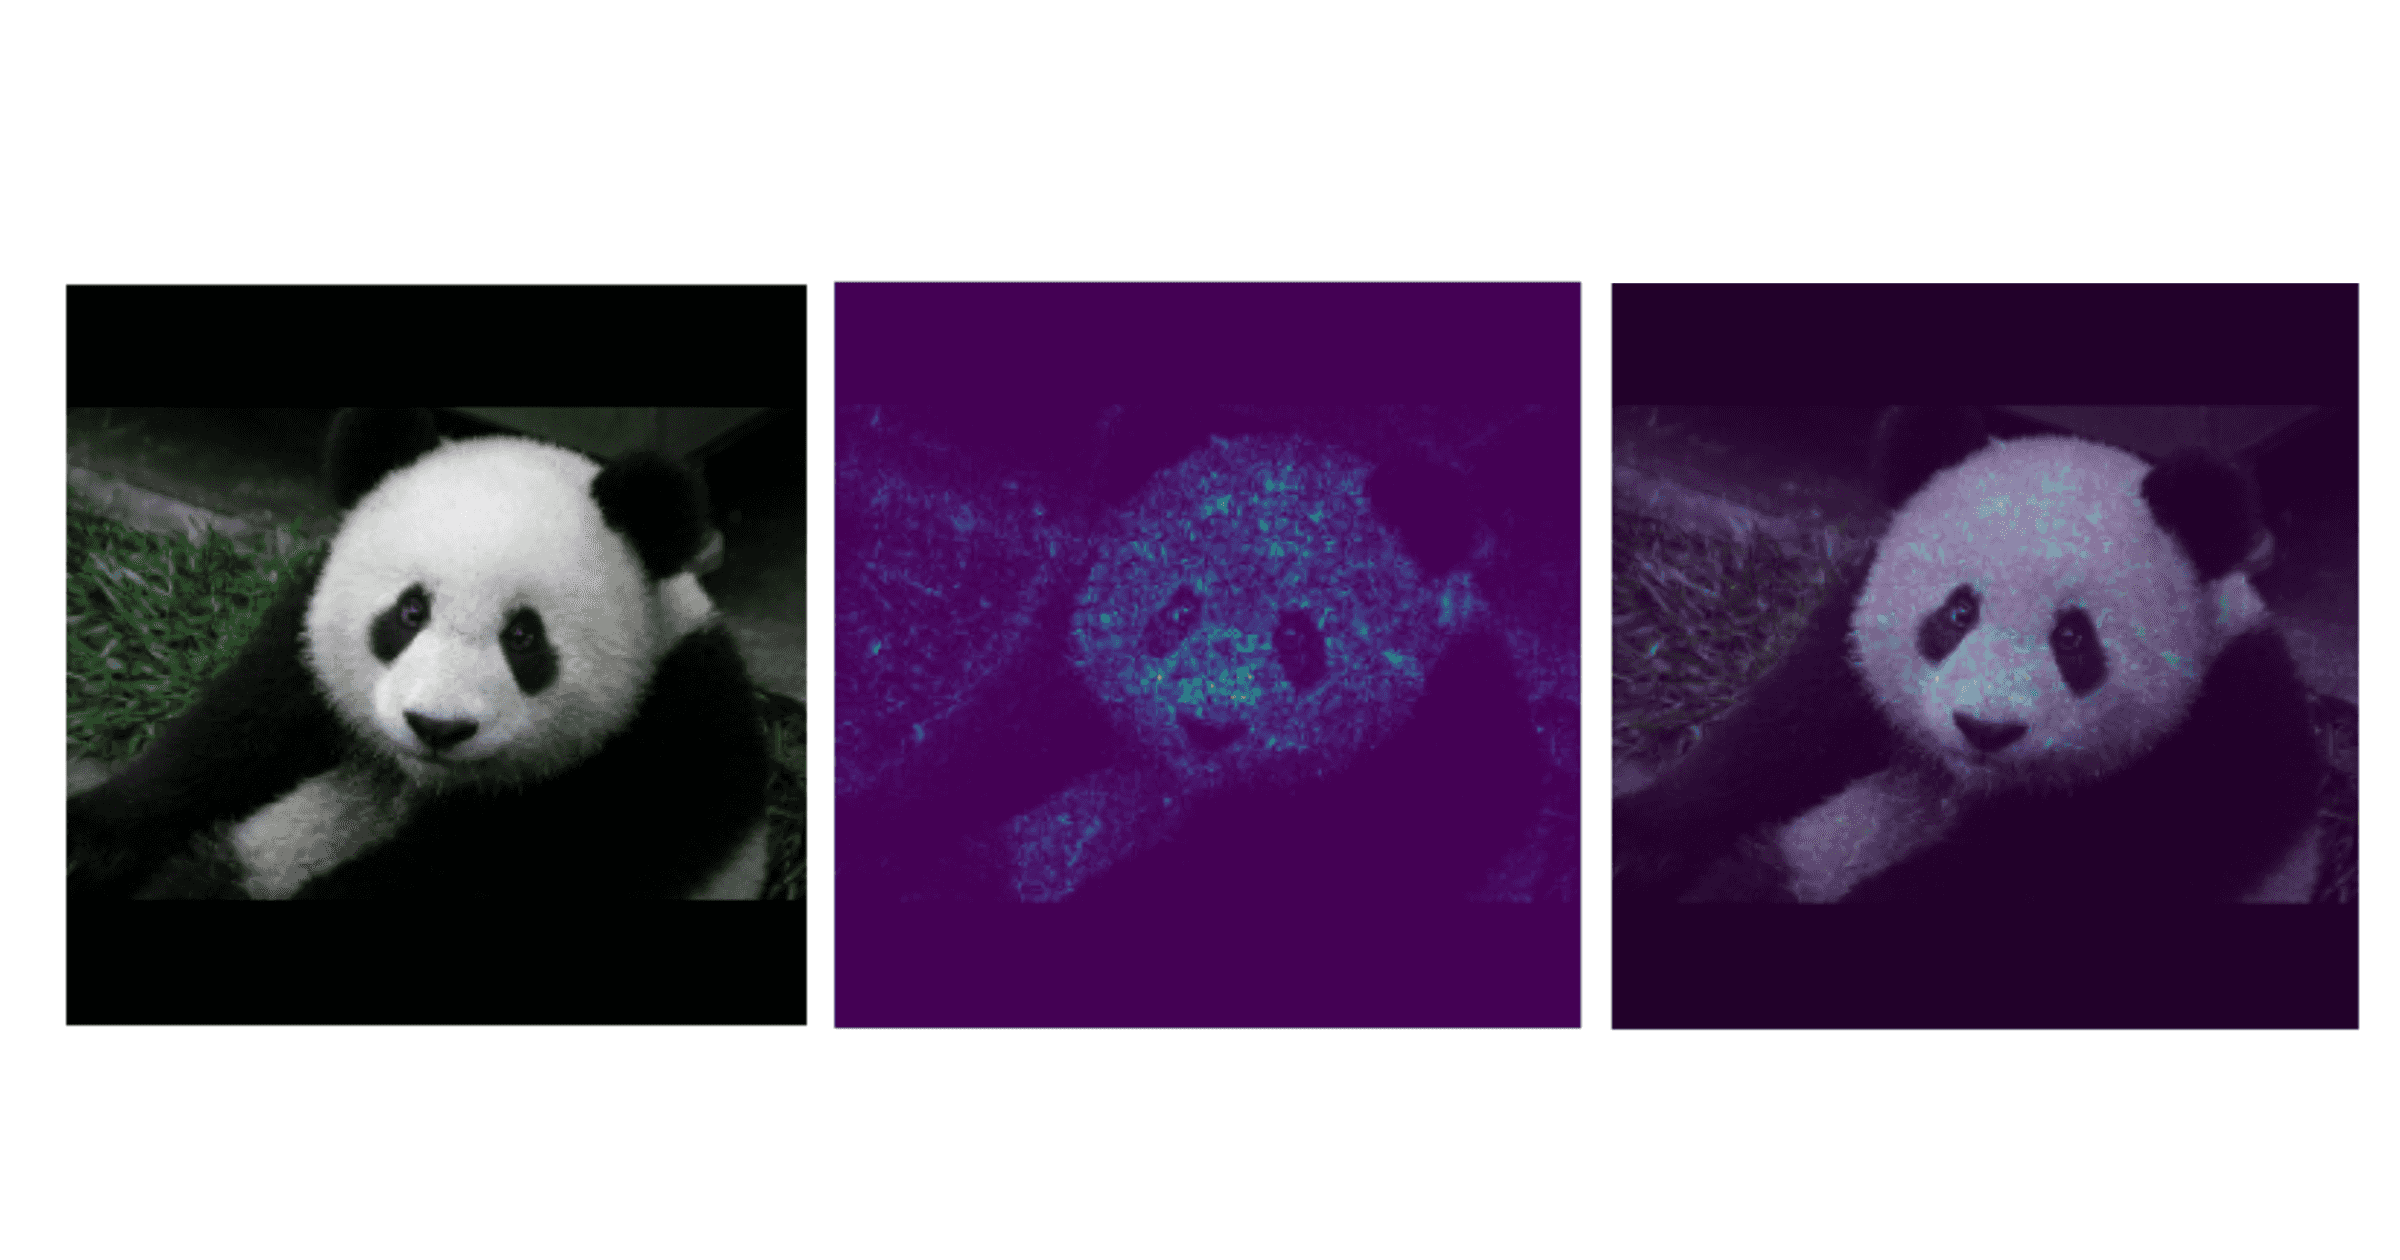
Integrated gradients1 is a popular Explainable AI method for deep learning networks that results in a “heatmap” that shows which pixels are most important to prediction. It would allow an analyst to cross check what pixels the model uses to identify a panda against “common sense.”
Why do Integrated Gradients Work?
Start with a Basic Model
We are going to start out with a very basic way of predicting pandas from images and build our way up from there to a deep learning model before we tackle integrated gradients.
We can start by coming up with predictors ("features") that determine if we are looking at a panda. One type of feature could be the number of colors in an image. If the image is solid white, you are more likely looking at a polar bear in a snowstorm 😊. Now I know you're saying - pandas are black & white, and they may be sitting in front of green grass; there is a lot more to classification than just color. I completely agree with you; classification of images is complex, but we are starting out with some critical concepts that we are going to need later.
Cool2 – so we have a concept that we can use to make predictions. Going forward, I am going to represent all of this as a formula, and I am going to use the following notation:
- : The probability that a defect has occurred.
- : A function that converts the inputs3 into the probability of defect.
- : The importance of the number of colors to the classification decision.
- : The number of colors detected in the image.
For the rest of this section, I am just going to add a bullet point with an explanation each time I need to add some type of math symbol.
So what we have so far is:
To give another example of a “handmade” feature, examine the size of the largest color in the image. Maybe a 1-pixel speck of white is noise, but if the majority of the image is white it might represent part of a panda.
- : The importance of the size of the color to the classification decision.
- : The size of the main color in the image.
Ok, so now we're getting somewhere. If there are multiple colors in the picture, and if the main color in the image is a panda color, then the combination of those two features might increase the probability that we have a panda in the image.
What if there is something other than color or the size of color (hint: there is) that could explain whether a defect could happen? We could explain that with some general “catch all” number called a bias4 .
Examine a Baseline for that Model
If we are going to start to examine our basic model and we are going to “explain” the model to a group of executives, we might first start talking about what the probability of getting a panda is without looking at anything related to color (we only look at the bias in this case). Then, we might want to talk about how the model is impacted once we start to see a lot of black or white in the picture. Likewise, we might talk about how the probability adjusts as you start to see an increase in the “size of a panda color.”
When we do this, we start to examine the idea of missingness. It is the idea that we want to compare what happens when there is an input to what happens when there are no inputs.
Extend the Analogy to Neural Networks
It becomes much harder to “explain” an interpretation of the pixels because the model has layers of activations (“neurons”).
One solution to this looks at gradients5 (“direction of maximum gain”) of an output category (e.g. “panda detected”) relative to the image that was fed into the model. This is similar to the concept that we just explored where we changed the number of colors and the size of the color to get a sense as to where there is maximum change in prediction.
The challenge with this approach is that neural networks are prone to a problem called saturation. The gradients of the input features (e.g. the white pixel in the panda image) may be small even if the neural network depends heavily on that pixel. Because it is small, we don’t get a sense as to which pixels are important.
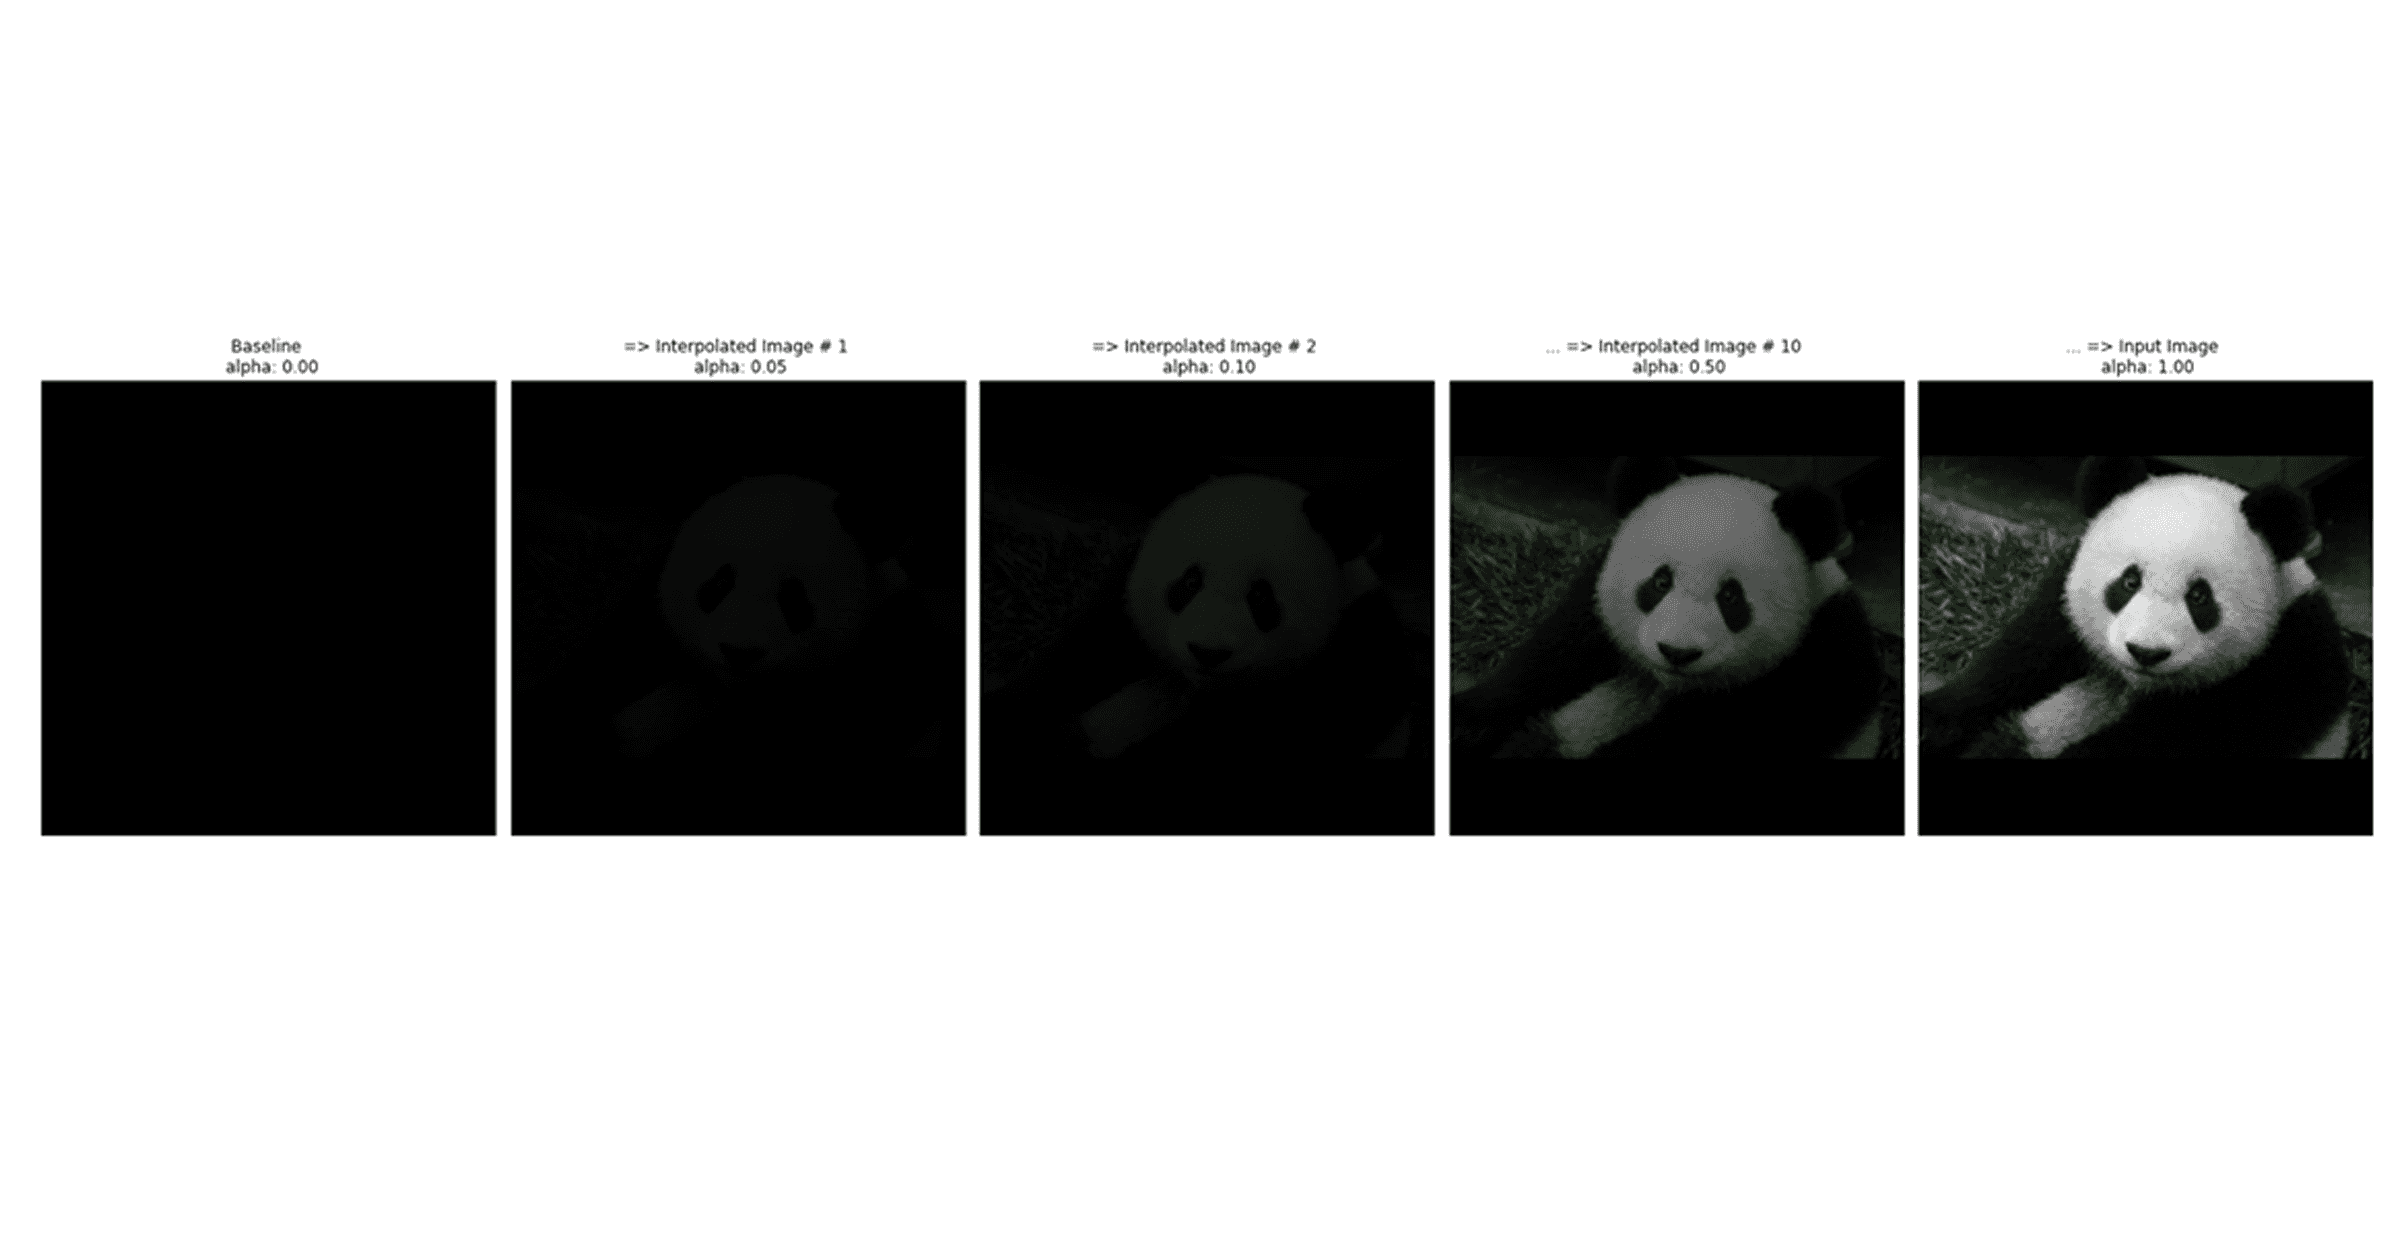
Integrated gradients solves the saturation problem this by looking at several defined steps to get the gradients. But defined steps against what? This is where the baseline that we discussed earlier is used.
Integrated gradients looks at the impact of a pixel on the classification and compares that against the impact that a black image (or any other ”baseline image ) has on classification.
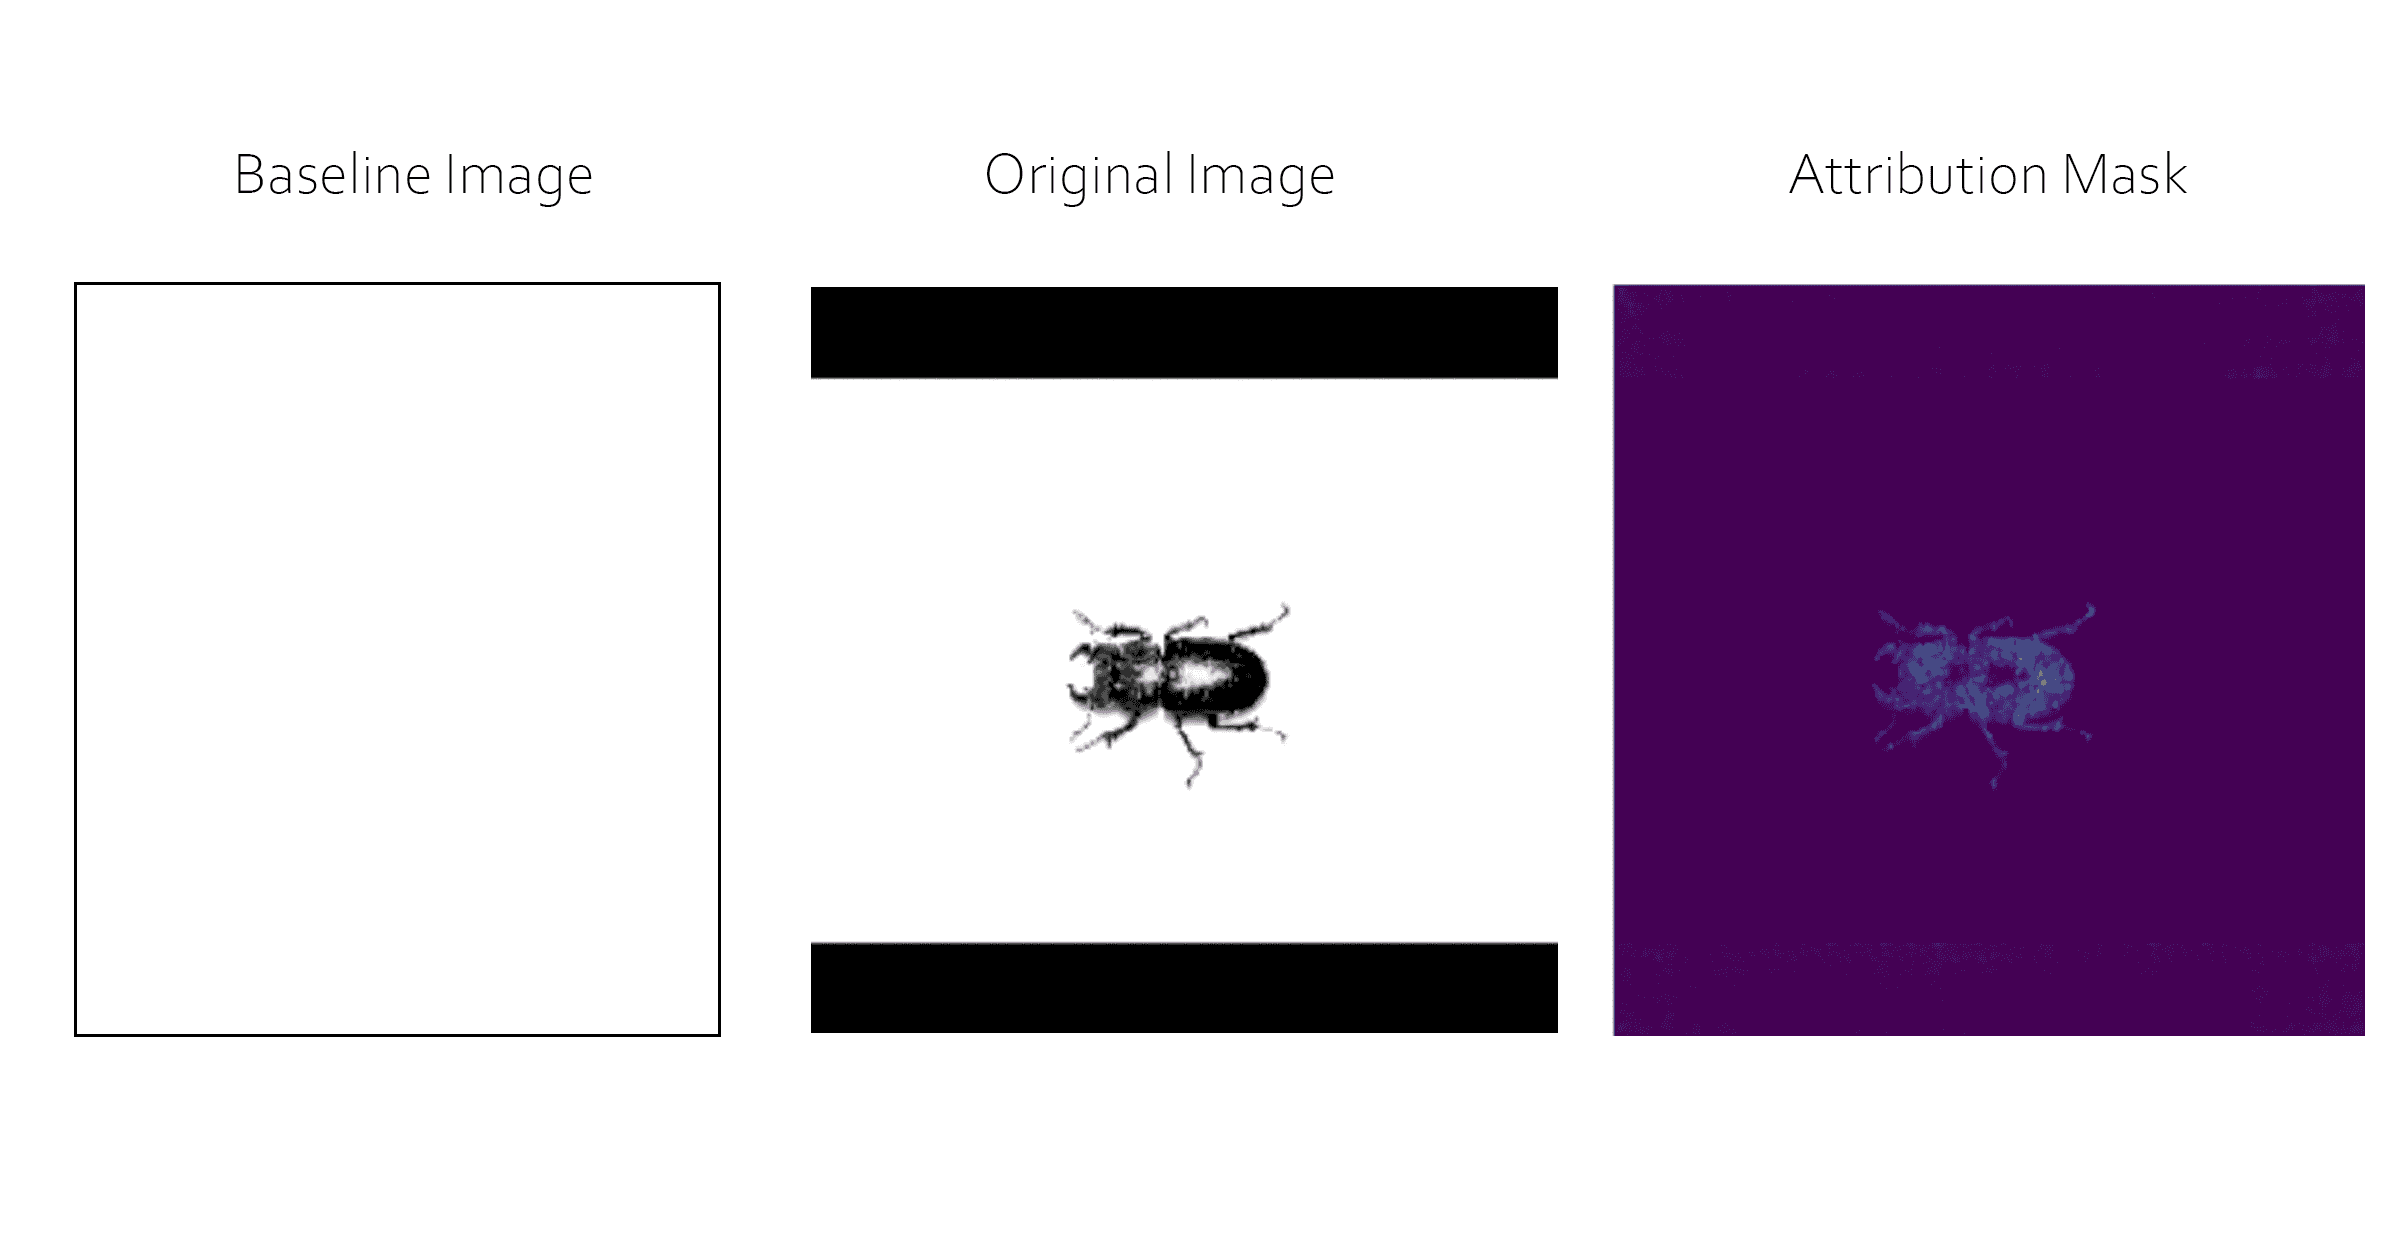
Ok one step further now. What kind of baseline should we use?
Although there are other articles that focus on optimal baselines6, the following are some initial baselines worth exploring:
- White background for black & white images or images that are black
- Black background for other types of images
How does this relate to the exam question?
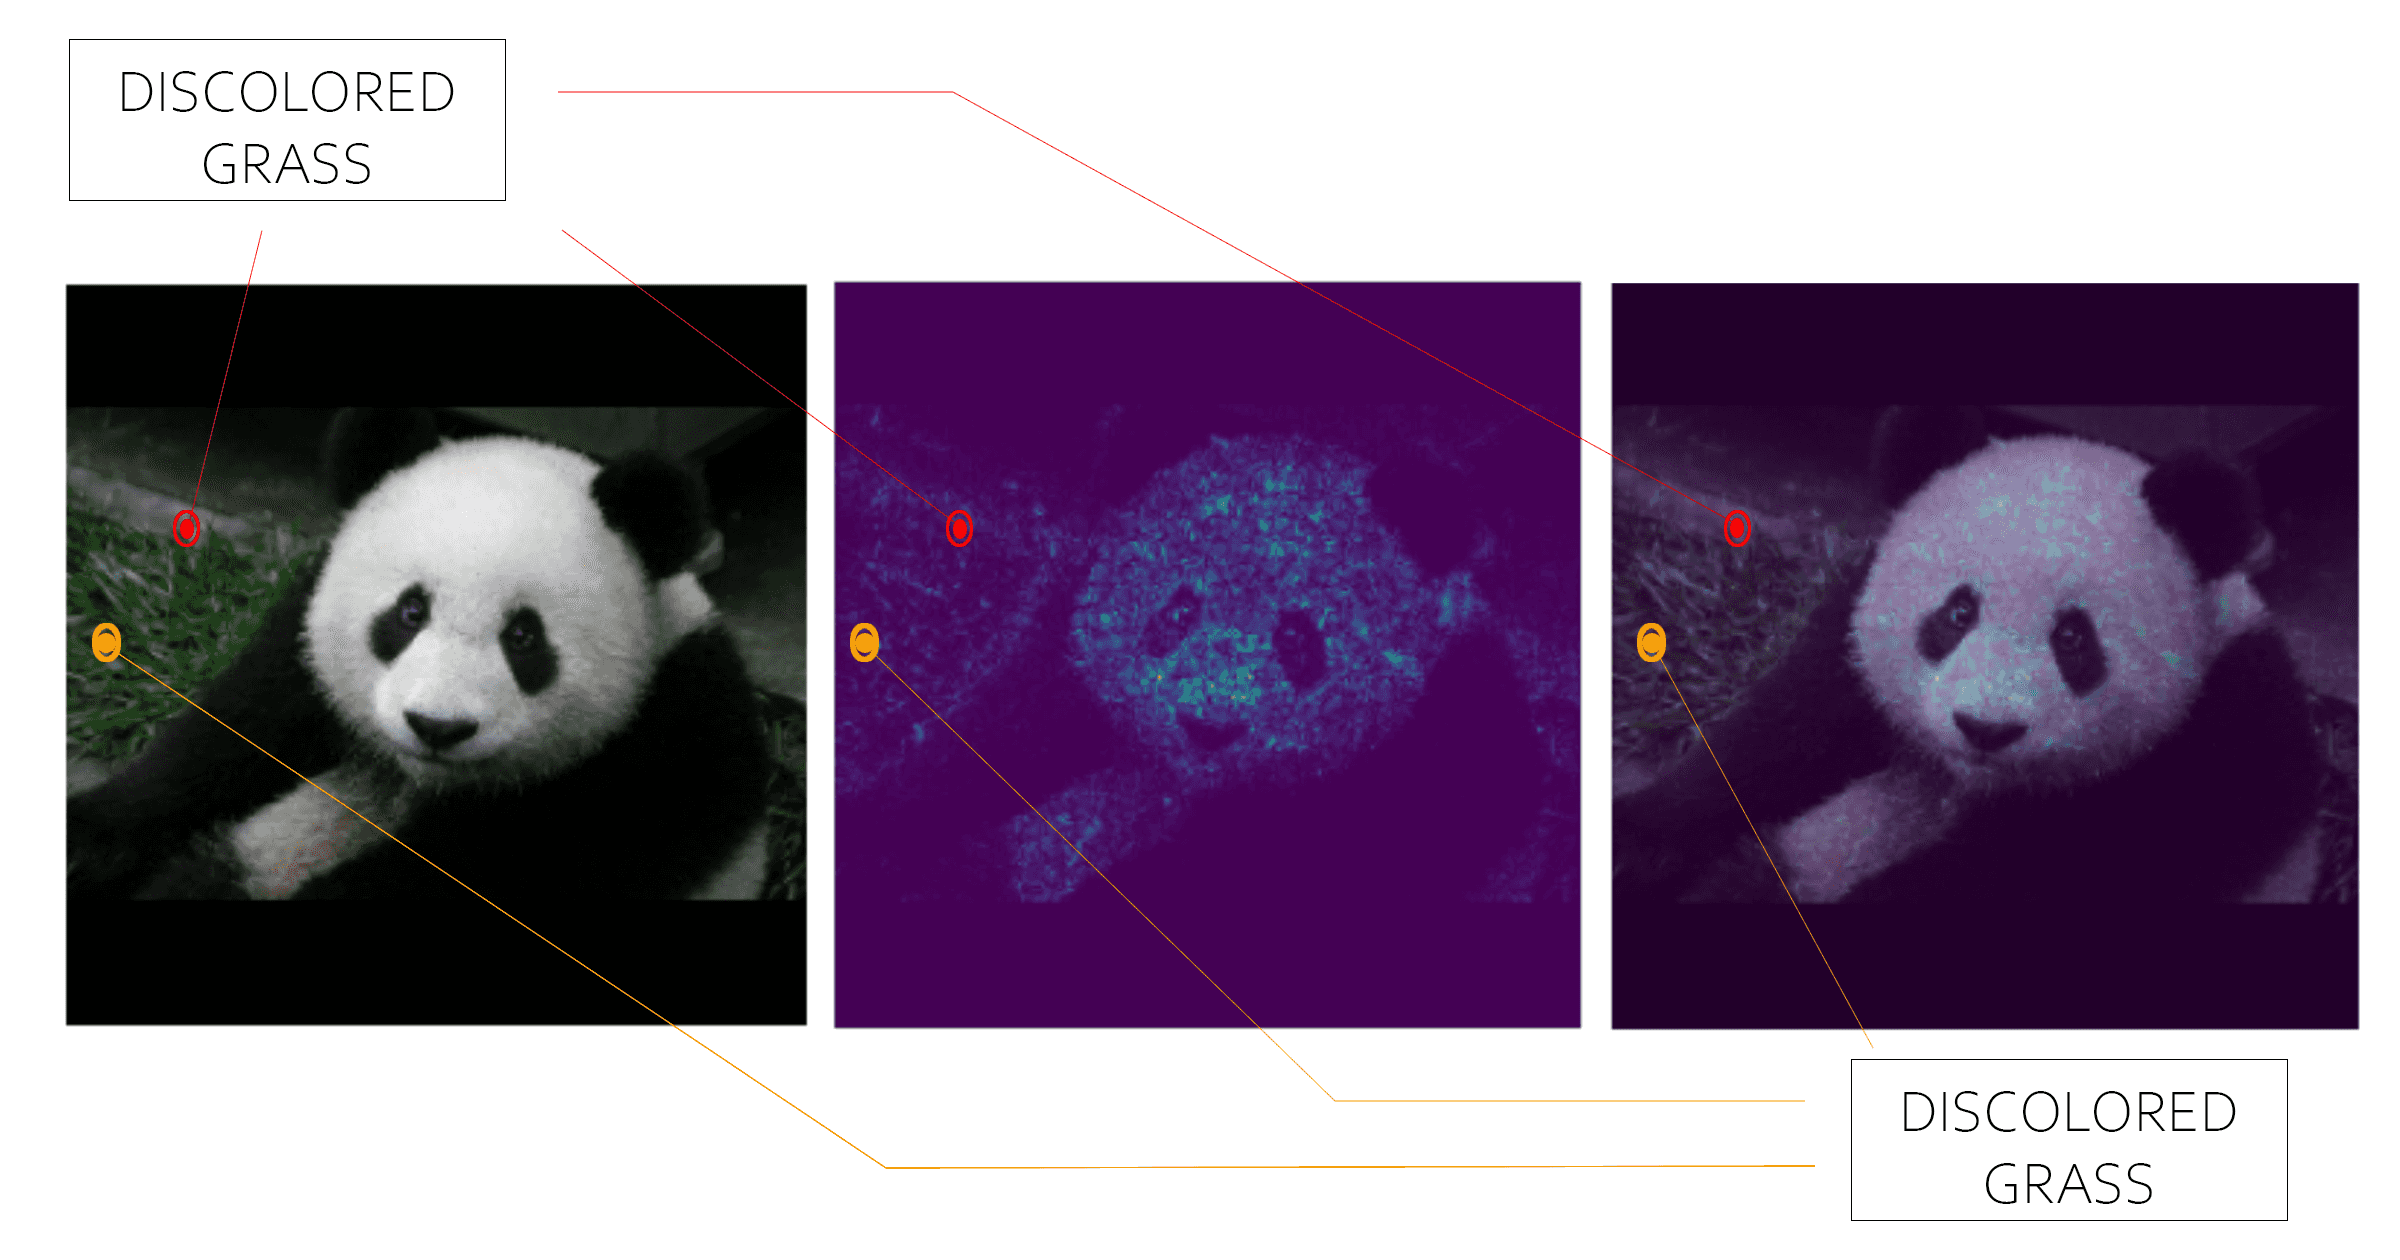
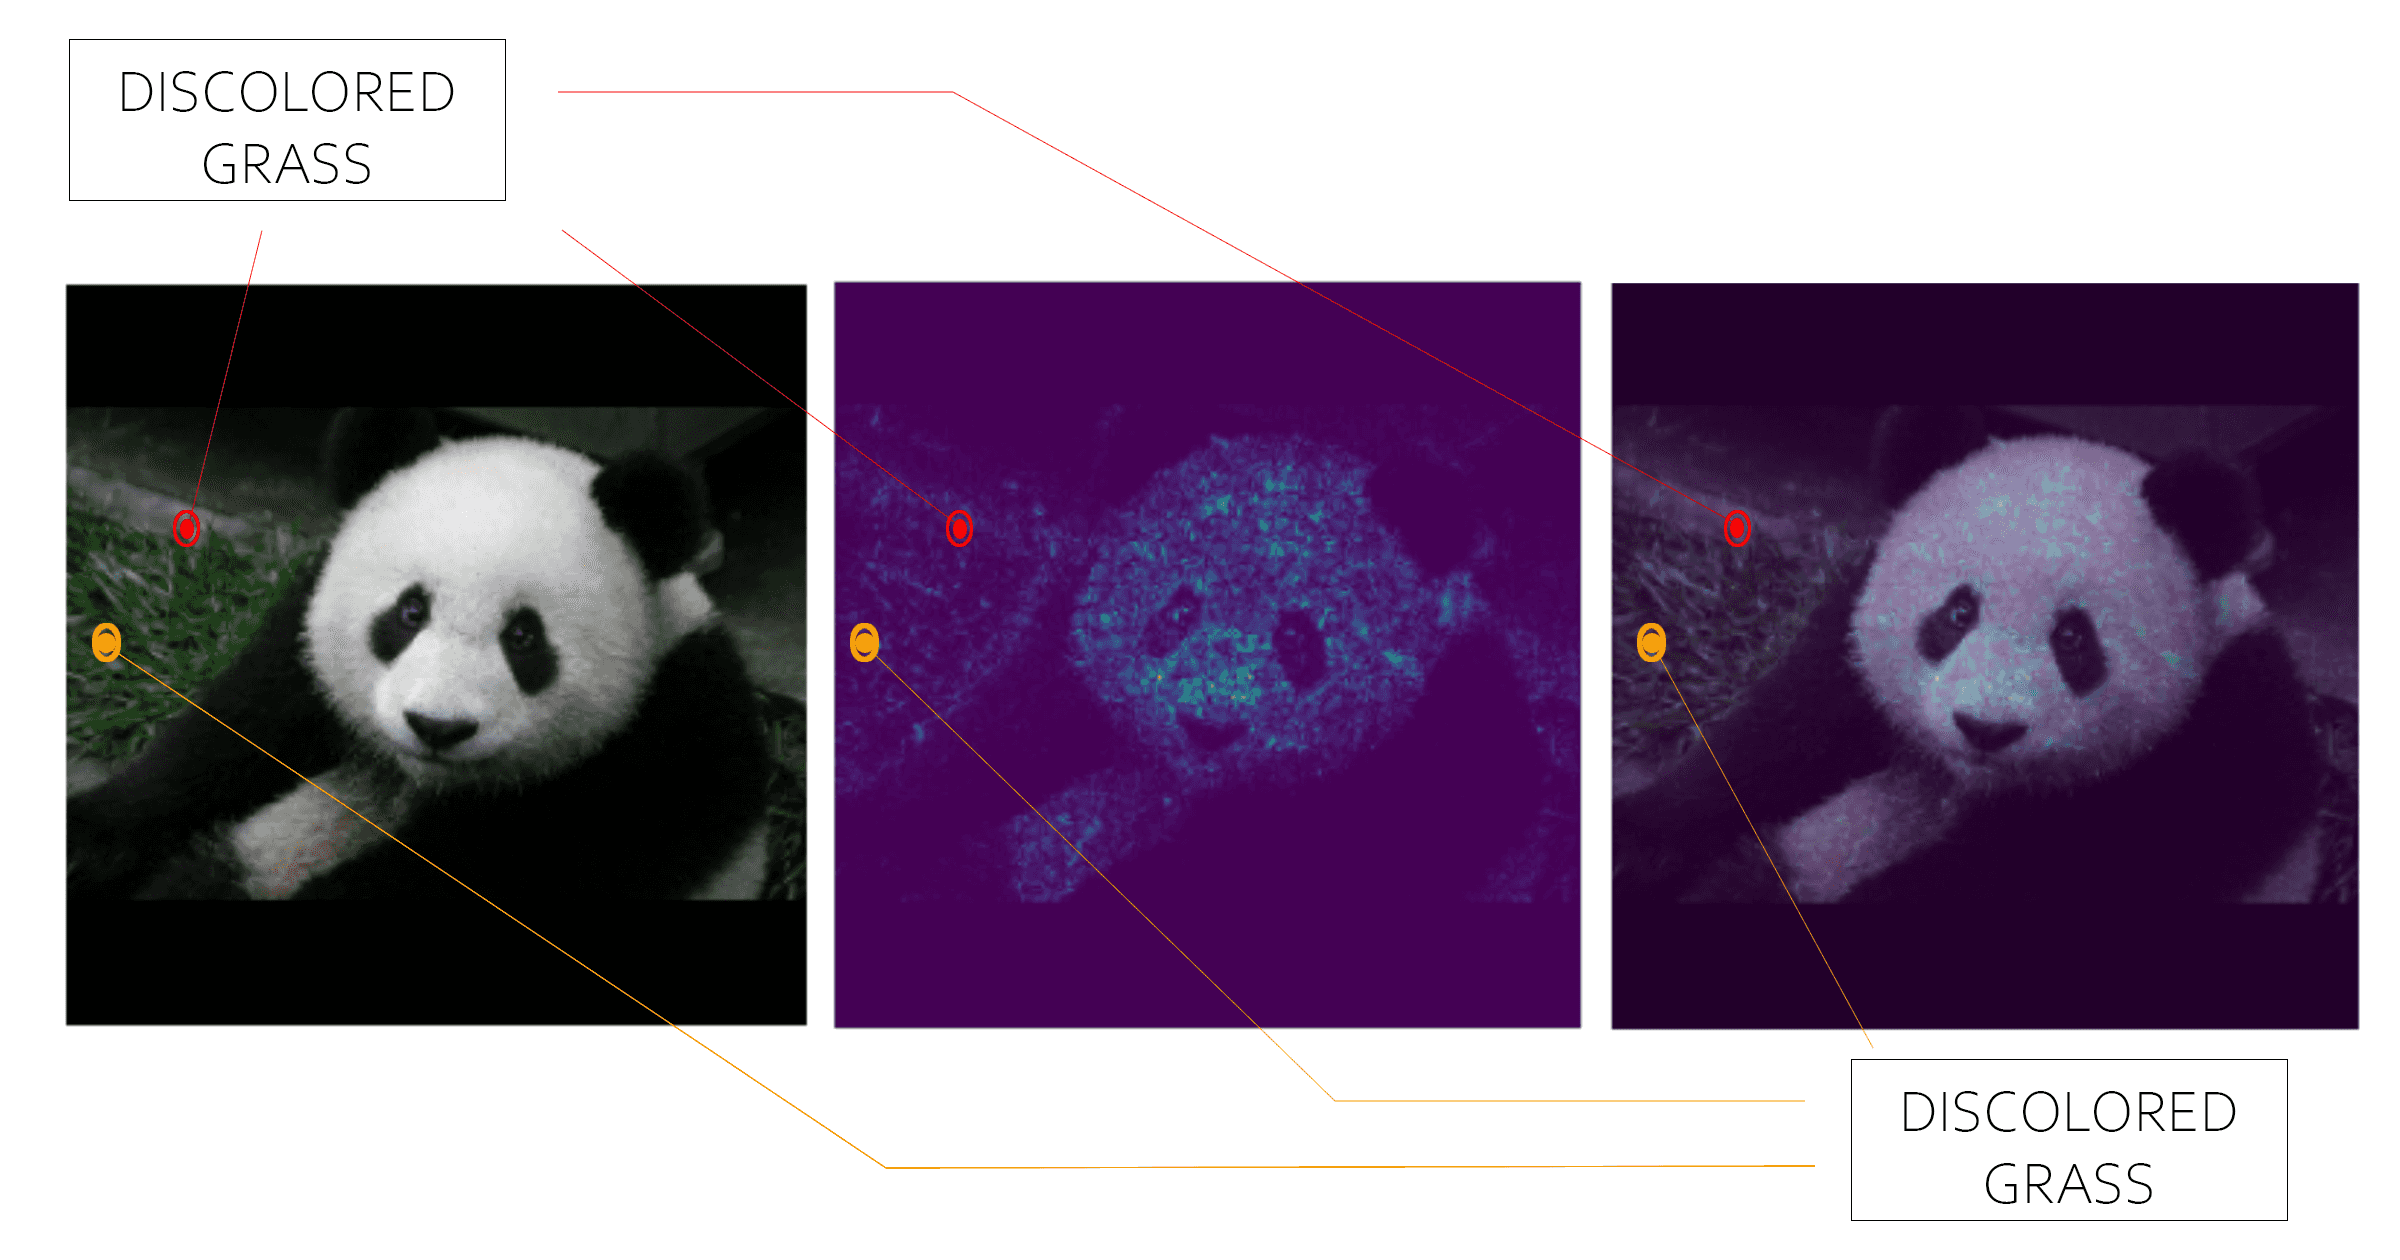
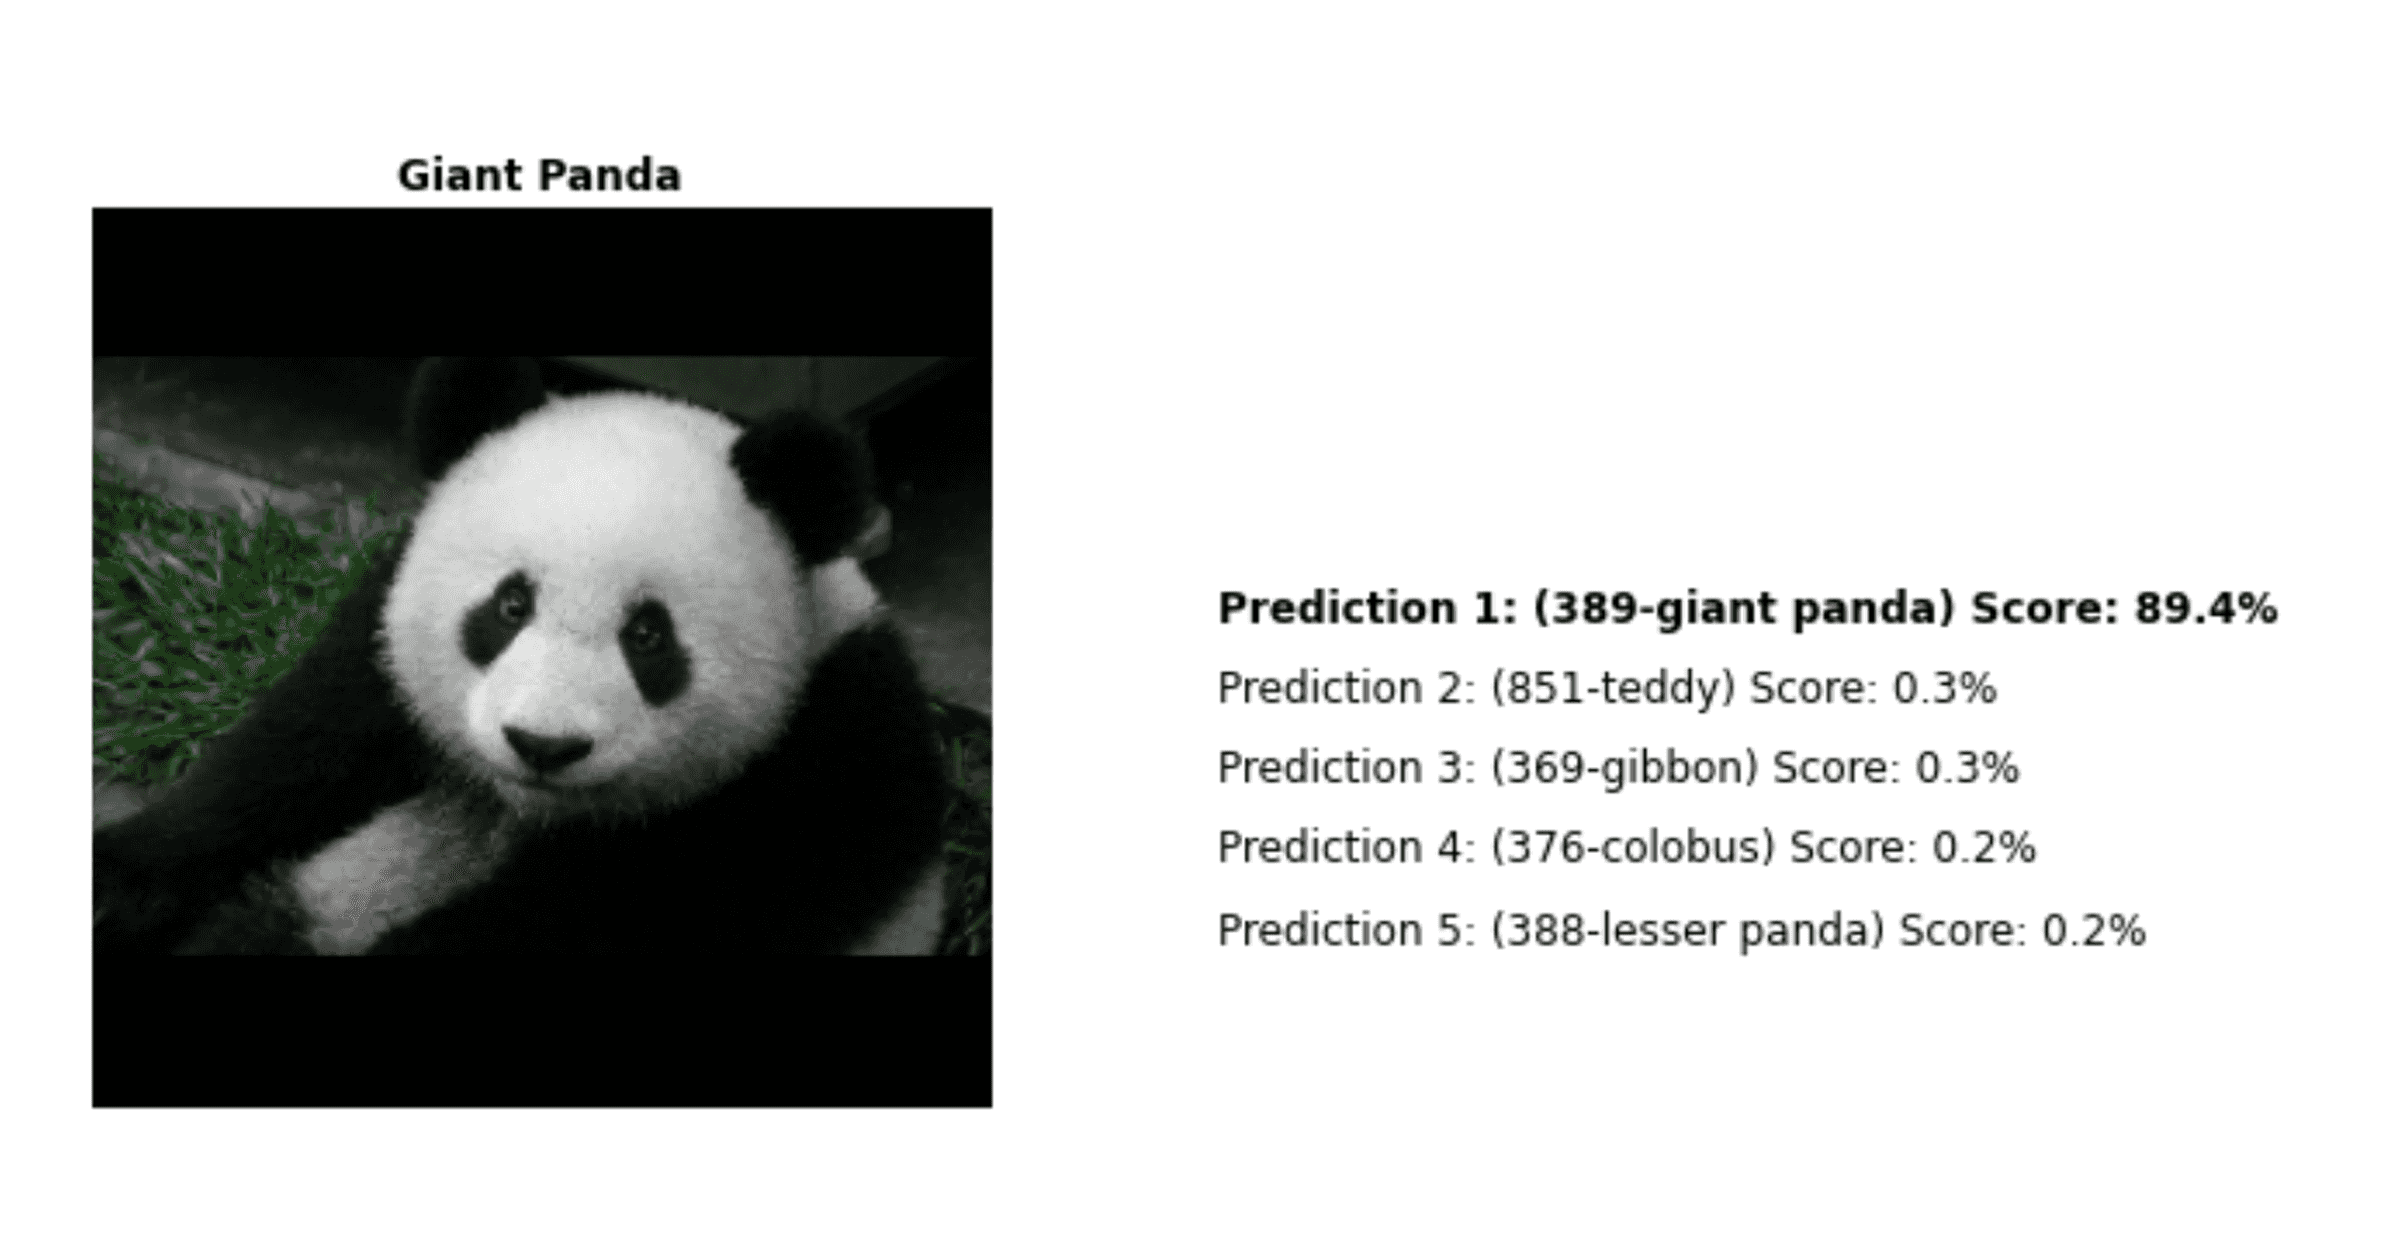
Consider the example above where a deep learning model (Inception v1) is classifying a panda7. Integrated gradients is not only identifying the head, nose, and eyes, but it also identifies pixels in the grass which helped do the classification. Since grass isn’t essential to what makes a panda… “ a panda”, feeding more panda images which do not have grass into the model might be a way to improve accuracy.
TAKEAWAY
The certification guide discusses integrated gradients broadly under:
4.3 Testing Models
- Model explainability
In fact, Google Cloud documentation actually gives an overview of Explainable AI.
Once you understand integrated gradients, it is easy to see that this is the obvious answer. Integrated gradients highlights the pixels that are relevant to the classification decision, and it does so in a way that can be easily interpreted by management.
Other Answers
There is a possibility though that you will not be familiar all of the answers for a certification exam question. If this is the case, don’t fret, you can still “eliminate bad answers” from consideration so that you have a better chance of selecting the correct answer. Let’s look at the other possible answers to the sample question to see techniques that could have been used to eliminate them from consideration.
K-fold Cross Validation
K-fold cross validation is not correct
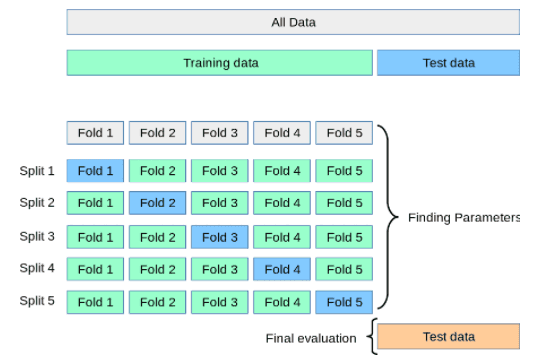
If you are building a panda detection model, it is likely that you will gather some images together before you even write any code. It is also likely that you will divide this data into three sections:
- Training set: 70% of your images
- Test set : 20% of your images
- Holdout set: 10% of the images.
If you use the training set of images to help the machine learn patterns in data, you could take the test set to do model evaluation. If you want to get a better sense of how the model is doing without going back to the camera feed to get more images, you could take different slices of your test set, and this “slicing approach” is called K-fold cross validation.
TAKEAWAY
Answer A is broadly covered under the Google Cloud certification outline under:
4.3 Testing models
- Model performance
The question already told you though that your model HAS good recall. This would imply that you have already evaluated performance and that Option A (K-fold cross validation) is not the best answer.
Principal Component Analysis
PCA is not correct

Principal Component Analysis is used for dimensionality reduction. If you are looking at an image of a panda that has a height of 244 pixels and a width of 244 pixels, and you apply PCA, then you are potentially trying to reduce 244 x 244 x (1 for RED + 1 for GREEN + 1 for BLUE) = 178,608 features into a smaller set of features that contains most of the information from the large set. As an example of an applied use, PCA could be used to do image compression.
TAKEAWAY
Option C states that “PCA would reduce the feature set,” and this is in line with the above explanation. Option C is clearly stating that PCA would not be used to look at the “inner workings” of the machine learning model that you created. Because of the wording of Option C, it is very easy to eliminate PCA as the correct answer.
K-Means Clustering
K-Means Clustering is not correct

K-means clustering groups information together. More importantly, this type of grouping takes place without the need for labeled data (it is a type of unsupervised learning). In fact, you can create a k-means model using BigQuery ML (a type of SQL) with just a few lines of code.
Clustering similar images together doesn’t give any insight into why a deep learning model is making a decision. Said differently, if you took several images of pandas, and if a clustering algorithm showed you the images without pandas, then you still have not gained anything (the question already tells you that the model is generating high recall). This process does not give any additional insight into the deep learning model.
TAKEAWAY
Option D refers examining images with clusters. Without even knowing what a Davies-Bouldin index is, you know that you are not gaining new information about a deep learning model with this approach. Because of this, it is easy to eliminate Option D.
Final Thoughts
At this point, you have a basic overview of one technique of how to create an image classification heatmap (integrated gradients). The footnotes at the end of this blog also point to additional resources if you want to implement this heatmap.
If you are preparing for the Google Cloud Machine Learning Engineer exam, you may also want do the following:
- Turn the exam guide into a study plan
- Review in depth all of the example questions that Google provides for the exam.
- Look at whitepapers provides in the sample questions including the Google whitepaper on AI Explainability.
- Review documentation for the question and for each potential answer
- For all of the documentation that you review, go one level deeper, and implement each part so that you have a better idea as to what is happening.
Thank you for Reading
Help support this site. If you liked what you read, please retweet this page on Twitter or mention it on your favorite social media site.